Creating responsive data visualizations by Gurman Bhatia
Videos · Data Visualization
Created by Rishabh Srivastava, Founder of Loki.ai
This summary was largely done for my own note-taking, sharing it just in case it adds more value to other people.
Context
Source URL:
Why is it important: Contains a summary of how to create responsive data visualizations that work really well across all screen sizes
Keywords
Dataviz, Data Visualization, Responsive Design
Highlights
Have killed multiple visualizations in the past because they don’t work across different screen sizes. Has come up with a bunch of heuristics to ensure that things work well across
I. 10 tips
1. Tweak the treatment based on screen size
For example, for a story about pollution in India, Asia was centred on mobile (image below). You could not see America in this image (which you could on mobile) but that’s okay because you can see India in much higher resolution
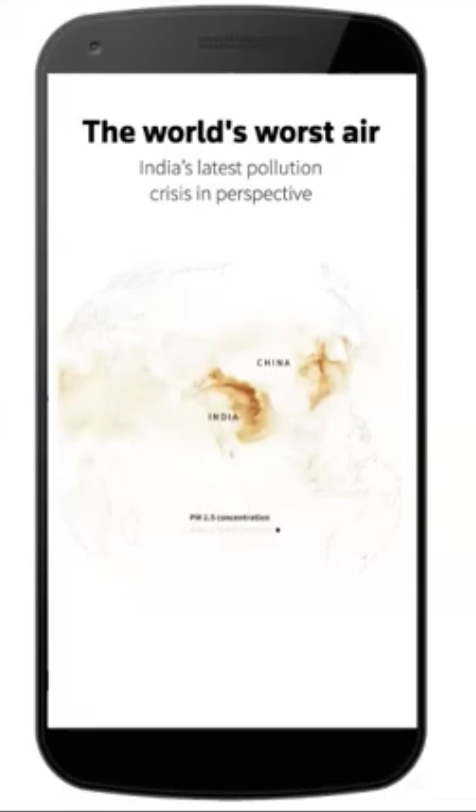
Another example: you can use small multiples on desktop, but use full width visualizations on mobile
2. Flip it!
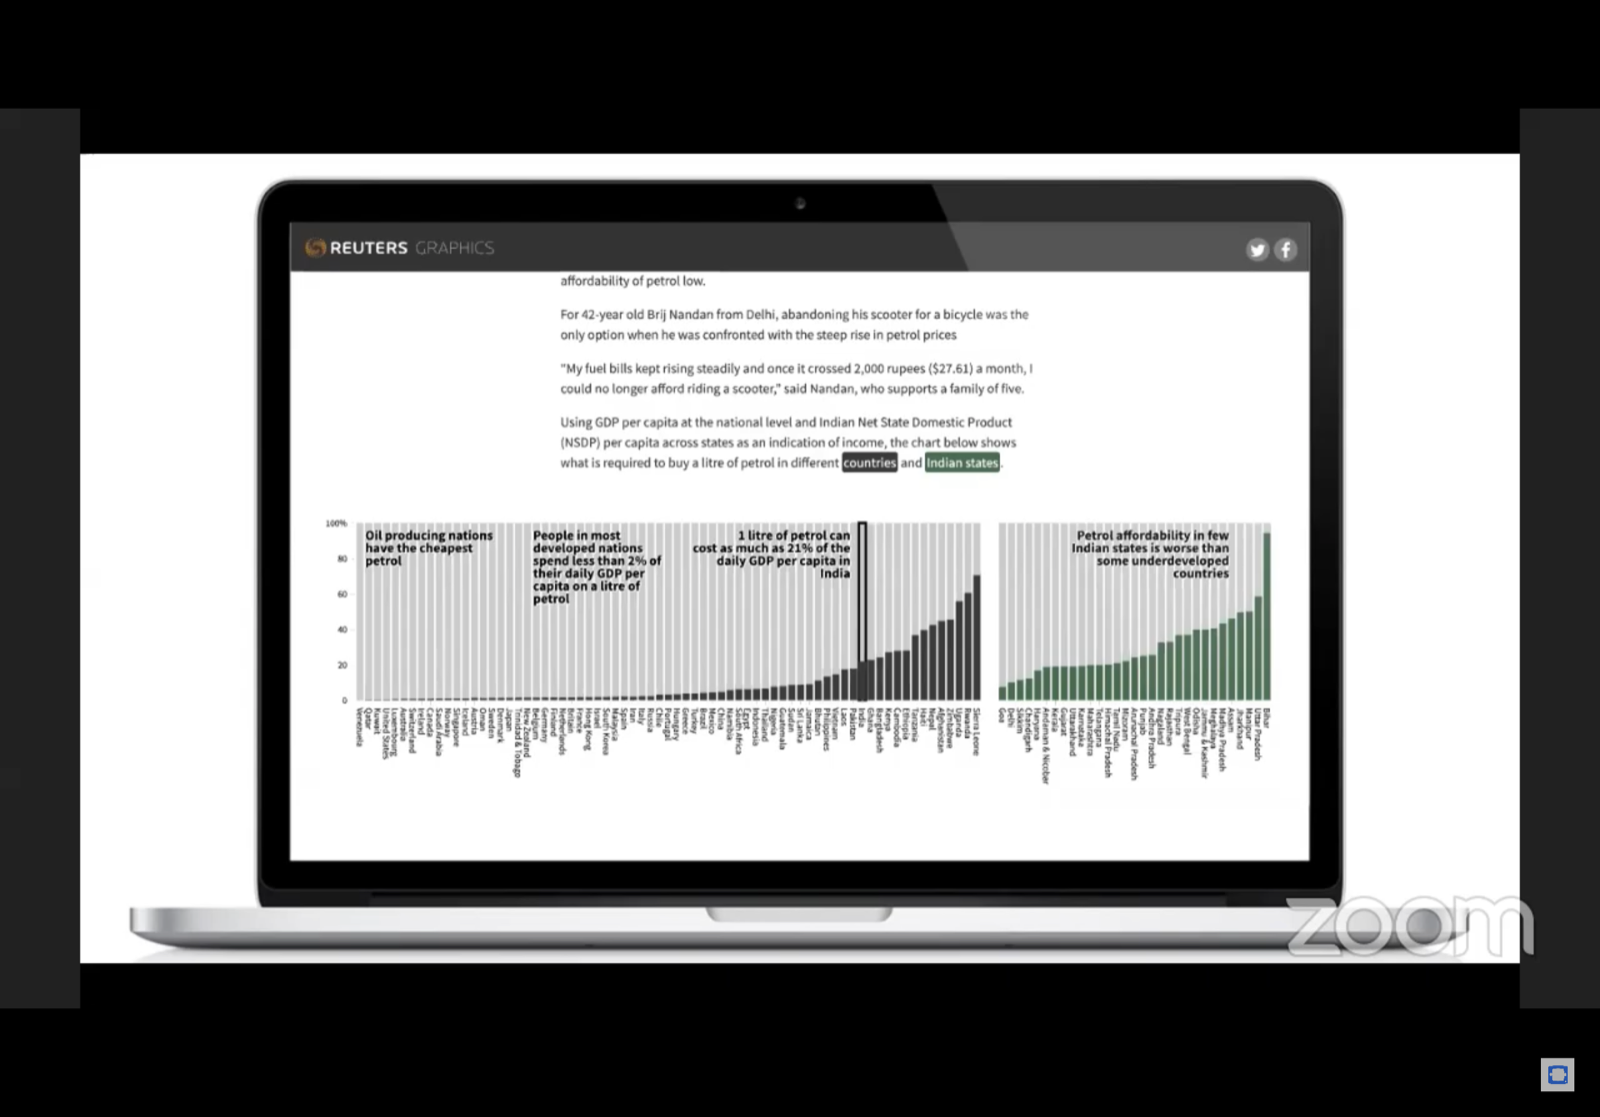
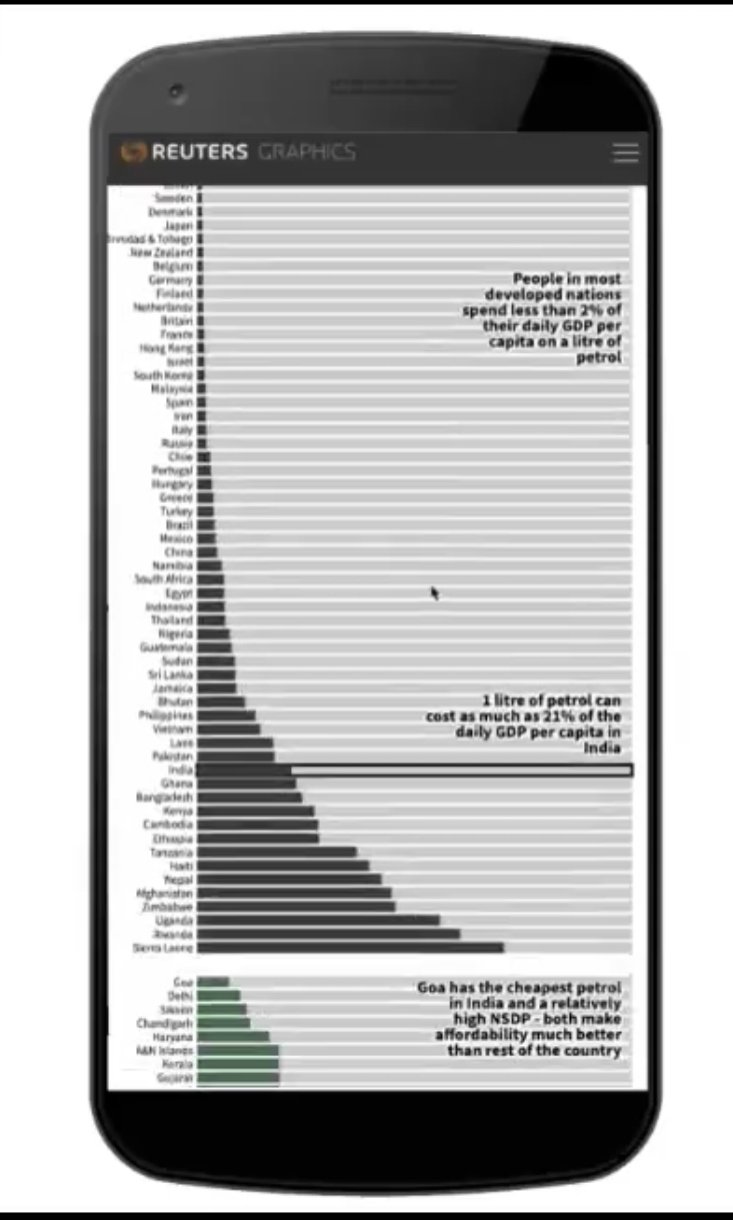
A horizontal “column chart” on desktop can be converted to a vertical “bar chart” on mobile
Desktop Version
Mobile Version
3. Make subtle design changes to make things more readable
Remove labels from maps and charts on mobile if they add too much clutter on a smaller screen
4. Make UX changes based on the device
Example: Inset world map for mobile, normal world map for desktop
5. If it works on mobile, it works on Desktop
This can be lead to a somewhat sub-optimal experience on Desktop, but can make the development process much easier
Technique: Create an A4 sheet and fold it in half. Then sketch on it to have a good idea of what mobile would look like
6. Be selective with interactivity. Interaction is expensive and comes at a cost
Often, animation is not as smooth on old/cheap devices if you use too much interactivity
Note: WebGL is changing this. So that’s something to keep an eye on if your audience uses WebGL compatible phones
7. Static visualizations are great
They are optimised for all devices. If you don’t need interactivity, just go with static visualizations
8. Exploit the scroll interaction
Scrolling is the most important thing for a person to do on the web. It’s also as mobile first as it gets.
“Scrolling is especially good for narratives because it is linear: you can only scroll in one dimension.”
- Mike Bostock
9. Don’t hide information in tool tips. Use annotations for context
Assuming that people will interact with a tooltip is bad. Tool tips can be used by your most invested users (maybe 1-2% of the audience). In general, use annotations instead of tool tips to tell the story. Only use tool tips for things that only the most invested users will use
10. Mobiles are a great lesson in editing. They help you focus on what is important
Mobile phones help you focus on what can be removed. That’s a good thing. Focusing only on what’s essential can help you
II. 3 tools
1. Custom charts using d3.js
- Javascript library that gives you a ton of control over your visualization
- Very useful whenever you need to go beyond “usual” charts, and want to do something extremely bespoke/creative
2. ai2html
- Javascript script for making static visualizations in illustrator, and the converting your visualization to HTML
3. pym.js
- Used for iframes and for helping people embed your iframe into your website
III. Questions
1. Prioritising form vs function
Function is much much more important than form. First, figure out what you’re trying to say. Then, focus on how you are saying it
Annotations are amazing for this. As long as you have good annotations on your visualization, you can tell a great story while creating a great viz
2. What kind of stories are good candidates for visualization?
Anything that has good data. Elections are always a great candidate. Also education data, health data (including coronavirus), and economic data
And sometimes, even if there isn’t hard data, you can have visual opportunities to explain things. For example, Gurman read a long medical paper and realised that it could have been portrayed as a Sankey diagram. Also, photos can often be data too (like taking photos every hour and using an animation to tell a story about pollution in Delhi)
3. Mobile-first vs desktop-first and then creating a mobile version?
Depends on person’s preferences and techniques. Gurman prefers to go mobile first, and that leads to less code being written
4. What is a typical design to dev workflow? Does it change project to project?
Depends on how urgent a project is. For a really urgent project, it’s more of an all-hands-on-deck.
They do a morning call to see if something should be created as a graphic. They talk about both immediate ideas or long-term ideas
Generally starts with research and finding out what data is available. Then, leads to cleaning of data and figuring out what that data tells you. Then, leads to data visualization
Data acquisition, cleaning and analysis typically takes the most time
5. What tech do you use to create a different version of the viz on desktop and mobile?
Mostly css media queries. D3 also lets you redraw your chart on a resize event if you want. You can also load certain videos/charts depending on the screen size. There’s a lot of display:none and display:block
6. Navigating touch vs pointer-based platforms
Will check for this. Can’t do hover based things on pointer-based platforms. On mobile, it’ll have to be a tap-based thing. Need to have a close tooltip option if a “tooltip” is implemented
7. Things you have to learn
- Thinking in visuals well and making good static visualizations