Scale, Geoffery West
Books · Business · Source
Summary
- There are mathematical relationships that describe how biological, societal, and economic systems scale with surprisingly good precision.
- These scaling laws are often bounded by "metabolism" (the process of how a system converts energy from one form to another) and "entropy" (the breakdown in systems that happens with use). Using a first principles modelling approach, we can see how difference in metabolic means results in biological systems growing sublinearly as they scale (leading to constrained growth), and societal/economic systems growing super linearly
- Societal systems have properties eerily similar to that of biological systems. They metabolize energy and resources, produce waste, process information, grow, adapt and evolve, contract disease, and even develop what could be characterized as tumors and growths.
- Larger cities require fewer resources per capita (like gas stations, roads) than smaller ones – and their economies of scale is very systematic. It is approximately the same across many countries, obeying a log-log power law with an exponent of around 0.85
- Similarly, the social factors in larger cities per capita (GDP, crime, AIDS, patent production) increases systematically and superlinearly with population, with a power-law exponent of 1.15
- Because of their superlinar scaling in resources generated per capita and sublinear scaling in infrastructure needed per capital, cities are almost impossible to kill (even cities like Hiroshima and Dresden survive to this day). This is is stark contrast to biological organisms and companies – all of which eventually die
- Companies can also be described by these principles, though with much greater variance. Their constraints are a) Minimizing transaction costs (this reflects economies of scale driven by an optimization principle, such as maximizing profits), b) organizational structure (the network system within a company that conveys information, resources, and capital to support, sustain, and grow the enterprise), c) competition (the evolutionary pressures and selection processes inherent in the ecology of the marketplace)
- Right now, it's difficult to apply these principles to companies because of a lack of data. We don’t typically know how many people are functioning at each level, how much of the company’s finances and resources are flowing between them, and how much information they are exchanging. If this becomes available, a "science" of how companies scale and can become more efficient might be created
Highlights
Introduction
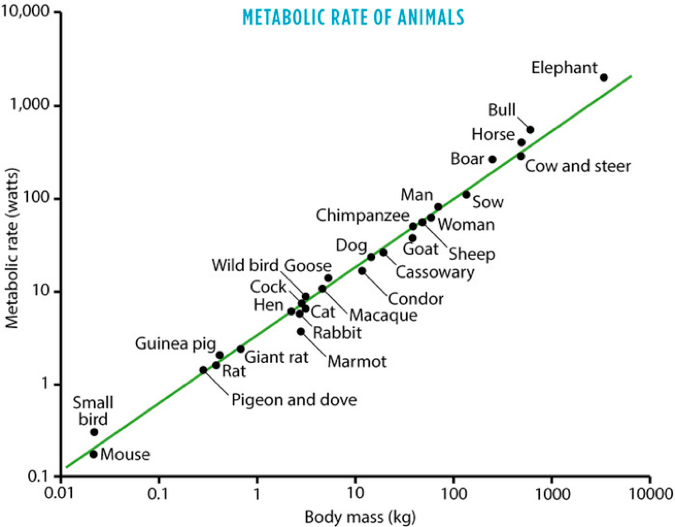
Now take a look at the panel of graphs in Figures 1–4. Each represents a well-known quantity that plays an important role in your life and each is plotted against size. The first graph is metabolic rate—how much food is needed each day to stay alive—plotted against the weight or mass of a series of animals. The second is the number of heartbeats in a lifetime, also plotted against the weight or mass of a series of animals. The third is the number of patents produced in a city plotted against its population. And the last is the net assets and income of publicly traded companies plotted against the number of their employees.
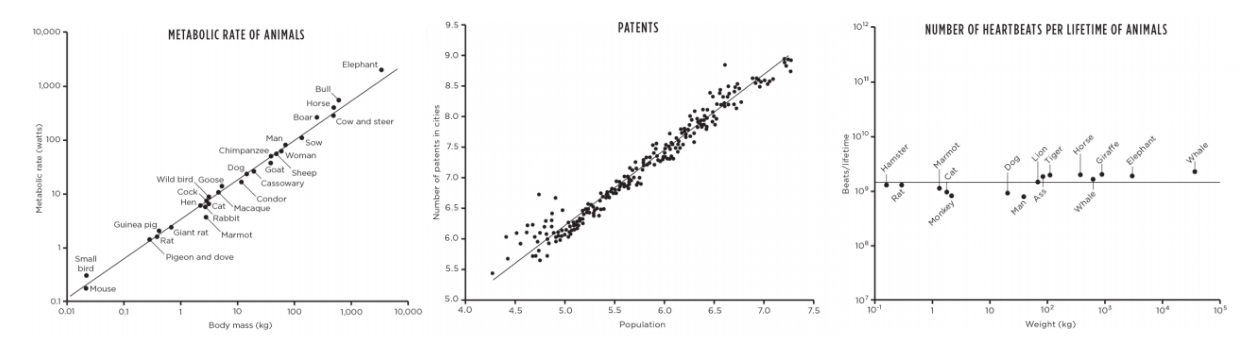
The existence of these remarkable regularities strongly suggests that there is a common conceptual framework underlying all of these very different highly complex phenomena and that the dynamics, growth, and organization of animals, plants, human social behavior, cities, and companies are, in fact, subject to similar generic “laws.”
Just two hundred years ago the United States was predominantly agricultural, with barely 4 percent of the population living in cities, compared with more than 80 percent today. This is typical of almost all developed countries such as France, Australia, and Norway, but it is also true for many that are considered as “developing,” such as Argentina, Lebanon, and Libya. Nowadays, no country on the planet comes close to being just 4 percent urban; even Burundi, perhaps the poorest and least developed of all nations, is over 10 percent urbanized.
In 2006 the planet crossed a remarkable historical threshold, with more than half of the world’s population residing in urban centers, compared with just 15 percent a hundred years ago and still only 30 percent by 1950. It is now expected to rise above 75 percent by 2050, with more than two billion more people moving to cities, mostly in China, India, Southeast Asia, and Africa.
when averaged over the next thirty-five years, about a million and a half people will be urbanized each week.
Inextricably, from now to well into the middle of the century another New York metropolitan area is being added to the planet every couple of months. And note that we are talking of a New York metropolitan area consisting of 15 million people, not just New York City, which has only 8 million.
Perhaps the most astonishing and ambitious urbanization program on the planet is being carried out by China, where the government is on a fast track to build up to three hundred new cities each in excess of a million people over the next twenty to twenty-five years.
The open-ended exponential growth of cities stands in marked contrast to what we see in biology: most organisms, like us, grow rapidly when young but then slow down, cease growing, and eventually die. Most companies follow a similar pattern, with almost all of them eventually disappearing, whereas most cities don’t.
if cities are indeed some sort of superorganism, then why do almost none of them ever die? There are, of course, classic examples of cities that have died, especially ancient ones, but they tend to be special cases due to conflict and the abuse of the immediate environment. Overall, they represent only a tiny fraction of all those that have ever existed.
Most companies, on the other hand, live for only a few years. Half of all U.S. publicly traded companies have disappeared within ten years of entering the market. Although a small minority live for considerably longer, almost all seem destined to go the way of Montgomery Ward, TWA, Studebaker, and Lehman Brothers. Why? Can we develop a serious mechanistic theory for understanding not only our own mortality but also that of companies?
we must first come to terms with how each of these systems grew and how each stays alive. In biology these are controlled and maintained by the process of metabolism. Quantitatively, this is expressed in terms of metabolic rate, which is the amount of energy needed per second to keep an organism alive; for us it’s about 2,000 food calories a day, which, surprisingly, corresponds to a rate of only about 90 watts,
incandescent lightbulb. As can be seen from Figure 1, our metabolic rate has the “correct” value for a mammal of our size. This is our biological metabolic rate living as naturally evolved animals.
in addition, we now require homes, heating, lighting, automobiles, roads, airplanes, computers, and so on. Consequently, the amount of energy needed to support an average person living in the United States has risen to an astounding 11,000 watts. This social metabolic rate is equivalent to the entire needs of about a dozen elephants.
Appropriating the concept from biology, I shall refer to all such processes of energy transformation as metabolism.
without a continuous supply of energy and resources, not only can there be no manufacturing of any of these things but, perhaps more important, there can be no ideas, no innovation, no growth, and no evolution. Energy is primary. It underlies everything that we do and everything that happens around us.
There is always a price to pay when energy is processed; there is no free lunch. Because energy underlies the transformation and operation of literally everything, no system operates without consequences. Indeed, there is a fundamental law of nature that cannot be transgressed, called the Second Law of Thermodynamics, which says that whenever energy is transformed into a useful form, it also produces “useless” energy as a degraded by-product: “unintended consequences” in the form of inaccessible disorganized heat or unusable products are inevitable. There are no perpetual motion machines.
Whenever energy is used or processed in order to make or maintain order within a closed system, some degree of disorder is inevitable—entropy always increases. The word entropy, by the way, is the literal Greek translation of “transformation” or “evolution.”
Dissipative forces, analogous to the production of disorganized heat by friction, are continually and inextricably at work leading to the degradation of all systems.
The battle to combat entropy by continually having to supply more energy for growth, innovation, maintenance, and repair, which becomes increasingly more challenging as the system ages, underlies any serious discussion of aging, mortality, resilience, and sustainability, whether for organisms, companies, or societies.
Much of the research and development on diseases, new drugs, and therapeutic procedures is undertaken using mice as “model” systems. This immediately raises the critical question of how to scale up the findings and experiments on mice to humans. For instance, huge resources are spent each year on investigating cancer in mice, yet a typical mouse develops many more tumors per gram of tissue per year than we do, whereas whales get almost none, begging the question as to the relevance of such research for humans.
if we are to gain a deep understanding and solve the challenge of human cancer from such studies we need to know how to reliably scale up from mice to humans, and conversely, down from whales.
A profound consequence of this rule is that on a per gram basis, the larger animal (the woman in this example) is actually more efficient than the smaller one (her dog) because less energy is required to support each gram of her tissue (by about 25 percent). Her horse, by the way, would be even more efficient. This systematic savings with increasing size is known as an economy of scale.
This reflects an essential feature of all cities, namely that social activity and economic productivity are systematically enhanced with increasing size of the population. This systematic “value-added” bonus as size increases is called increasing returns to scale by economists and social scientists, whereas physicists prefer the more sexy term superlinear scaling.
A typical complex system is composed of myriad individual constituents or agents that once aggregated take on collective characteristics that are usually not manifested in, nor could easily be predicted from, the properties of the individual components themselves.
a city is much more than the sum of its buildings, roads, and people, a company much more than the sum of its employees and products, and an ecosystem much more than the plants and animals that inhabit it. The economic output, the buzz, the creativity and culture of a city or a company all result from the nonlinear nature of the multiple feedback mechanisms embodied in the interactions between its inhabitants, their infrastructure, and the environment.
a universal characteristic of a complex system is that the whole is greater than, and often significantly different from, the simple linear sum of its parts.
This collective outcome, in which a system manifests significantly different characteristics from those resulting from simply adding up all of the contributions of its individual constituent parts, is called an emergent behavior. It is a readily recognizable characteristic of economies, financial markets, urban communities, companies, and organisms.
The study of complex systems has taught us to be wary of naively breaking the system down into independently acting component parts. Furthermore, a small perturbation in one part of the system may have giant consequences elsewhere. The system can be prone to sudden and seemingly unpredictable changes—a market crash being a classic example.
One or more trends can reinforce other trends in a positive feedback loop until things swiftly spiral out of control and cross a tipping point beyond which behavior radically changes. This was spectacularly manifested by the 2008 meltdown of financial markets across the globe
This systematic regularity follows a precise mathematical formula which, in technical parlance, is expressed by saying that “metabolic rate scales as a power law whose exponent is very close to the number ¾.”
elephants are roughly 10,000 times (four orders of magnitude, 104) heavier than rats; consequently, they have roughly 10,000 times as many cells. The ¾ power scaling law says that, despite having 10,000 times as many cells to support, the metabolic rate of an elephant (that is, the amount of energy needed to keep it alive) is only 1,000 times (three orders of magnitude, 10^3) larger than a rat’s; note the ratio of 3:4 in the powers of ten. This represents an extraordinary economy of scale as size increases, implying that the cells of elephants operate at a rate that is about a tenth that of rat cells. Parenthetically, it’s worth pointing out that the subsequent decrease in the rates of cellular damage from metabolic processes underlies the greater longevity of elephants and provides the framework for understanding aging and mortality.
This scaling law for metabolic rate, known as Kleiber’s law after the biologist who first articulated it, is valid across almost all taxonomic groups, including mammals, birds, fish, crustacea, bacteria, plants, and cells. Even more impressive, however, is that similar scaling laws hold for essentially all physiological quantities and life-history events, including growth rate, heart rate, evolutionary rate, genome length, mitochondrial density, gray matter in the brain, life span, the height of trees and even the number of their leaves. Furthermore, when plotted logarithmically this dizzying array of scaling laws all look like Figure 1 and therefore have the same mathematical structure.
They are all “power laws” and are typically governed by an exponent (the slope of the graph), which is a simple multiple of ¼, the classic example being the ¾ for metabolic rate. So, for example, if the size of a mammal is doubled, its heart rate decreases by about 25 percent. The number 4 therefore plays a fundamental and almost magically universal role in all of life.13
Growth can be viewed as a special case of a scaling phenomenon. A mature organism is essentially a nonlinearly scaled-up version of the infant—just compare the various proportions of your body with those of a baby. Growth at any stage of development is accomplished by apportioning the metabolic energy being delivered through networks to existing cells to the production of new cells that build up new tissue.
Because cells are constrained to operate systematically slower in larger organisms relative to smaller ones, the pace of life systematically decreases with increasing size. Thus, large mammals live longer, take longer to mature, have slower heart rates, and cells that don’t work as hard as those of small mammals, all to the same predictable degree. Small creatures live life in the fast lane while large ones move ponderously, though more efficiently, through life;
Scaling as a manifestation of an underlying network theory implies that despite external appearances and habitats, a whale is to a good approximation a scaled-up elephant, an elephant is a scaled-up dog, and a dog is, in turn, a scaled-up mouse, when viewed in terms of their measurable characteristics and traits. At an 80 to 90 percent level they are scaled versions of one another following predictable nonlinear mathematical rules. Put slightly differently, all mammals that have ever existed including you and me are, on average, approximately scaled versions of a single idealized mammal. Could this be true of cities and companies?
as a function of population size, city infrastructure—such as the length of roads, electrical cables, water pipes, and the number of gas stations—scales in the same way whether in the United States, China, Japan, Europe, or Latin America.
these quantities scale sublinearly with size, indicating a systematic economy of scale but with an exponent of about 0.85 rather than 0.75. So, for example, across the globe, fewer roads and electrical cables are needed per capita the bigger the city.
Socioeconomic quantities such as wages, wealth, patents, AIDS cases, crime, and educational institutions, which have no analog in biology and did not exist on the planet before humans invented cities ten thousand years ago, also scale with population size but with a superlinear (meaning bigger than one) exponent of approximately 1.15.
Could there possibly be a quantitative, predictive science of companies?
like organisms and cities, companies also scale as simple power laws.
they scale sublinearly as functions of their size, rather than superlinearly like socioeconomic metrics in cities. In this sense, companies are much more like organisms than cities.
The scaling exponent for companies is around 0.9, to be compared with 0.85 for the infrastructure of cities and 0.75 for organisms. However, there is considerably more variation around precise scaling among companies than for organisms or cities. This is especially so in their early stages of development as they jostle for a place in the market.
For organisms, the sublinear scaling of metabolic rate underlies their cessation of growth and a size at maturity that remains approximately stable until death.
As they grow companies tend to become more and more unidimensional, driven partially by market forces but also by the inevitable ossification of the top-down administrative and bureaucratic
Cities, on the other hand, become increasingly multidimensional as they grow in size. Indeed, in stark contrast to almost all companies, the diversity of cities, as measured by the number of different kinds of jobs and businesses that comprise their economic landscape, continually and systematically increases in a predictable way with increasing city size. From
this perspective it comes as no surprise that the growth and mortality curves of companies closely resemble the corresponding growth and mortality curves of organisms. Both cases exhibit systematic sublinear scaling, economies of scale, bounded growth, and finite life spans.
when an object is scaled up in size, its volumes increase at a much faster rate than its areas. Let me give a simple example: if you double the dimensions of every length in your house keeping its shape the same, then its volume increases by a factor of 23 = 8 while its floor area increases by only a factor of 22 = 4. To
as we scale up a building or an animal, their weights increase in direct proportion to their volumes provided, of course, that the materials they’re made of don’t change so that their densities remain the same: so doubling the volume doubles the weight. Thus, the weight being supported by a pillar or a limb increases much faster than the corresponding increase in strength, because weight (like volume) scales as the cube of the linear dimensions whereas strength increases only as the square. To
Consequently, if the size of the structure, whatever it is, is arbitrarily increased it will eventually collapse under its own weight. There are limits to size and growth.
relative strength becomes progressively weaker as size increases. Or, as Galileo so graphically put it: “the smaller the body the greater its relative strength. Thus a small dog could probably carry on his back two or three dogs of his own size; but I believe that a horse could not carry even one of his own size.”
Biological Systems
Although it may sound somewhat eccentric to use elephants rather than mice as the “model” for studying the effects of LSD, there were some not entirely implausible reasons for doing so. It so happens that Asiatic elephants periodically undergo an unpredictable transition from their normal placid obedient state to one in which they become highly aggressive and even dangerous for periods of up to two weeks. West and his collaborators speculated that this bizarre and often destructive behavior, known as musth, was triggered by the autoproduction of LSD in elephants’ brains. So the idea was to see if LSD would induce this curious condition and, if so, thereby gain insight into LSD’s effects on humans from studying how they react. Pretty weird, but maybe not entirely unreasonable.
how much LSD should you give an elephant?
Tusko weighed about 3,000 kilograms, so using the number known to be safe for cats, they estimated that a safe and appropriate dose for Tusko would be about 0.1 milligram per kilogram multiplied by 3,000 kilograms, which comes out to 300 milligrams of LSD. The amount they actually injected was 297 milligrams. Recall that a good hit of LSD for you and me is less than a quarter milligram. The results on Tusko were dramatic and catastrophic. To quote directly from their paper: “Five minutes after the injection he [the elephant] trumpeted, collapsed, fell heavily onto his right side, defecated, and went into status epilepticus.” Poor old Tusko died an hour and forty minutes later. Perhaps almost as disturbing as this awful outcome was that the investigators concluded that elephants are “proportionally very sensitive to LSD.”
The problem, of course, is something we’ve already stressed several times, namely the seductive trap of linear thinking. The calculation of how big a dosage should be used on Tusko was based on the implicit assumption that effective and safe dosages scale linearly with body weight so that the dosage per kilogram of body weight was presumed to be the same for all mammals. The 0.1 milligram per kilogram of body weight obtained from cats was therefore naively multiplied by Tusko’s weight, resulting in the outlandish estimate of 297 milligrams, with disastrous consequences.
Among the many factors involved, metabolic rate plays an important role. Drugs, like metabolites and oxygen, are typically transported across surface membranes, sometimes via diffusion and sometimes through network systems. As a result, the dose-determining factor is to a significant degree constrained by the scaling of surface areas rather than the total volume or weight of an organism, and these scale nonlinearly with weight. A simple calculation using the ⅔ scaling rule for areas as a function of weight shows that a more appropriate dose for elephants should be closer to a few milligrams of LSD rather than the several hundred that were actually administered. Had this been done, Tusko would no doubt have lived and a vastly different conclusion about the effects of LSD would have been drawn.
Unlike the cubic scaling law, the conventional definition of the BMI has no theoretical or conceptual underpinning and is therefore of dubious statistical significance. In contrast, the cubic law does have a conceptual basis and if we control for the characteristics of the cohort is supported by data. It is not surprising, therefore, that an alternative definition of the BMI has been suggested in which the BMI is defined as body weight divided by the cube of the height; it is known as the Ponderal index. Although it does somewhat better than the Quetelet definition in being meaningfully correlated with body fat content, it nevertheless suffers from similar problems because it has not been deconstructed into cohorts having similar characteristics.
Galileo’s deceptively simple argument for why there are limits to the heights of trees, animals, and buildings has profound consequences for design and innovation. Earlier, when explaining his argument I concluded with the remark: Clearly, the structure, whatever it is, will eventually collapse under its own weight if its size is arbitrarily increased. There are limits to size and growth. To which should have been added the critical phrase “unless something changes.”
Change and, by implication, innovation, must occur in order to continue growing and avoid collapse. Growth and the continual need to be adapting to the challenges of new or changing environments, often in the form of “improvement” or increasing efficiency, are major drivers of innovation.
Consequently, in order to build larger structures or evolve larger organisms beyond the limits set by the scaling laws, innovations must occur that either change the material composition of the system or its structural design, or both.
A simple example of the first kind of innovation is to use a stronger material such as steel in place of wood for bridges or buildings, while a simple example of the second kind is to use arches, vaults, or domes in their construction rather than just horizontal beams and vertical pillars.
beam bridge. Given the limited tensile strength of wood there is clearly a limit as to how long a span can be traversed in this way. This was solved by the simple design innovation of introducing stone support piers in the middle of the river that effectively extended the bridge to be a succession of individual beam bridges.
An alternative strategy was the much more sophisticated innovation of constructing bridges entirely of stone and using the physical principles of the arch, thereby changing both the materials and design. Such bridges had the great advantage of being able to withstand conditions that would damage or destroy earlier designs. Remarkably, arched stone bridges go back more than three thousand years to the Greek Bronze Age (thirteenth century BC), with some still in use today. The greatest stone arch bridge builders of antiquity were the Romans, who built vast numbers of beautiful bridges and aqueducts throughout their empire, many of which still stand.
Nowadays, every conceivable process or physical object, from automobiles, buildings, airplanes, and ships to traffic congestion, epidemics, economies, and the weather, is simulated on computers as “models” of the real thing. I discussed earlier how specially bred mice are used in biomedical research as scaled-down “models” of human beings. In all of these cases, the big question is how do you realistically and reliably scale up the results and observations of the model system to the real thing?
So who was Isambard Kingdom Brunel, and why is he famous? Many consider him the greatest engineer of the nineteenth century, a man whose vision and innovations, particularly concerning transport, helped make Britain the most powerful and richest nation in the world. He was a true engineering polymath who strongly resisted the trend toward specialization. He typically worked on all aspects of his projects beginning with the big-picture concept through to the detailed preparation of the drawings, carrying out surveys in the field and paying attention to the minutiae of design and manufacture.
In 1830 at age twenty-four Brunel won a very stiff competition to build a suspension bridge over the River Avon Gorge in Bristol. It was an ambitious design and, upon its eventual completion in 1864, five years after his death, it had the longest span of any bridge in the world (702 feet, and 249 feet above the river). Brunel’s father did not believe that a single span of such a length was physically possible and recommended that Isambard include a central support for the bridge, which he duly ignored.
One of his most fascinating innovations was the unique introduction of a broad gauge of 7 feet ¼ inch for the width between tracks. The standard gauge of 4 feet 8½ inches, which was used in all other British railways at that time, was adopted worldwide and is used on almost all railways today. Brunel pointed out that the standard gauge was an arbitrary carryover from the mine railways built before the invention of the world’s first passenger trains in 1830. It had simply been determined by the width needed to fit a cart horse between the shafts that pulled carriages in the mines. Brunel rightly thought that serious consideration should be given to determining what the optimum gauge should be and tried to bring some rationality to the issue. He claimed that his calculations, confirmed by a series of trials and experiments, showed that his broader gauge was the optimum size for providing higher speeds, greater stability, and a more comfortable ride to passengers. Consequently, the Great Western Railway was unique in having a gauge that was almost twice as wide as every other railway line. Unfortunately, in 1892, following the evolution of a national railway system, the British Parliament forced the Great Western Railway to conform to the standard gauge, despite its acknowledged inferiority.
a simple scaling argument. He realized that the volume of cargo a ship could carry increases as the cube of its dimensions (like its weight), whereas the strength of the drag forces it experiences as it travels through water increases as the cross-sectional area of its hull and therefore only as the square of its dimensions.
Thus the strength of the hydrodynamic drag forces on a ship relative to the weight of the cargo it can carry decreases in direct proportion to the length of the ship. Or to put it the other way around: the weight of its cargo relative to the drag forces its engines need to overcome systematically increases the bigger the ship. In other words, a larger ship requires proportionately less fuel to transport each ton of cargo than a smaller ship.
Although these conclusions were nonintuitive and not generally believed, Brunel and the Great Western Steamship Company were convinced. Brunel boldly proceeded to design the company’s first ship, the Great Western, which was the first steamship purposely built for crossing the Atlantic. She was a paddle-wheel ship constructed of wood (with four sails as backup, just in case) and, when completed in 1837, was the largest and fastest ship in the world.
Following the success of the Great Western and confirmation of the scaling argument that bigger ships were more efficient than smaller ones, Brunel moved to build an even larger one, brazenly combining new technologies and materials never before incorporated into a single design. The Great Britain, launched in 1843, was built of iron rather than wood and driven by a screw propeller in the rear rather than paddle wheels on the sides. In so doing, the Great Britain became the prototype for all modern ships. She was longer than any previous ship and was the first iron-hulled, propeller-driven ship to cross the Atlantic.
When systems fail or designs don’t meet their expectations there are usually a plethora of reasons that could be the problem. These include poor planning and execution, faulty workmanship or materials, poor management, and even a lack of conceptual understanding. However, there are key examples like that of the Great Eastern where the major reason for failure was that they were designed without a deep understanding of the underlying science and of the basic principles of scale.
During the building of the Great Eastern, Brunel had asked Froude to investigate the problem of the rolling and stability of ships. This eventually led him to answer the critical question as to what the optimum shape of a hull should be that would minimize the viscous drag forces of water. The economic implications for shipping and global trade resulting from his work were huge. Thus was born the modern science of ship design.
However, of even greater impact and longer-term importance was his introduction of the revolutionary concept of modeling a system in order to determine how the real system worked.
Indeed, studying turbulence gave us the first important mathematical insights into the concept of complexity and its relationship to nonlinearity. Complex systems often manifest chaotic behavior in which a small change or perturbation in one part of the system produces an exponentially enhanced response in some other part.
Despite 150 years of intense theoretical and experimental study, a general understanding of turbulence remains an unsolved problem in physics even though we have learned an enormous amount about it. Indeed the famous physicist Richard Feynman described turbulence as “the most important
Despite 150 years of intense theoretical and experimental study, a general understanding of turbulence remains an unsolved problem in physics even though we have learned an enormous amount about it. Indeed the famous physicist Richard Feynman described turbulence as “the most important unsolved problem of classical physics.”15
Froude may not have fully recognized just how big a challenge he was facing but he did perceive that for applications to shipbuilding a new strategy was needed. It was in this context that he invented the new methodology of modeling and, by extension, the concept of scaling theory for determining how quantitative results from small-scale investigations could be used to help predict how full-size ships would behave.
the spirit of Galileo, Froude realized that almost all scaling is nonlinear, so traditional models based on a faithful 1:1 representation were not useful for determining how the actual system works.
His seminal contribution was to suggest a quantitative mathematical strategy for figuring out how to scale from the small-size model to the full-size object. Like
many new ideas that threaten to change the way we think about an old problem, Froude’s endeavors were at first dismissed as irrelevant by the cognoscenti of the time. John Russell, who founded the Institution for Naval Architects in England in 1860 in order to encourage the formal education of ship designers, ridiculed Froude: “You will have on the small scale a series of beautiful, interesting little experiments which, I am sure, will afford Mr. Froude infinite pleasure in the making of them . . . and will afford you infinite pleasure in the hearing of them; but which are quite remote from any practical results upon the large scale.” Many of us recognize this kind of rhetoric, often aimed at scholarly or academic research with the implication that it is out of touch with the “real world.” Well, no doubt, much of it is. But much of it isn’t and, more to the point, it is very often difficult to perceive in the moment the potential impact of some piece of seemingly arcane research.
tension in society between supporting what is perceived as pie-in-the-sky basic research with no obvious immediate benefit versus highly directed research focused on “useful, real world” problems.
Froude made small models of ships, three to twelve feet long, that he dragged through water contained in long tanks and measured their resistance to flow as well as their stability characteristics. With his mathematical background he possessed the technical machinery for knowing how to scale up his findings to large ships.
Let me give a simple illustration of this by asking how fast a 10-foot-long model ship would have to move to mimic the motion of the 700-foot-long Great Eastern moving at 20 knots (a little over 20 mph). If they are to have the same Froude number (that is, the same value of the square of their velocity divided by their length), then the velocity must scale as the square root of their lengths. Now, the ratio of the square root of their lengths is √(700 ft./10 ft.), which is √70 = 8.4. So, for the 10-foot model to mimic the Great Eastern it must move with a speed of approximately 20/8.4 = 2.5 knots, which is just about walking speed. In other words, the dynamics of a 10-foot-long model ship moving at just 2.5 knots simulates that of the 700-foot-long Great Eastern moving at 20 knots.
The scaling methodology introduced by Froude has now evolved to become a powerful and sophisticated component of the tool kit of science and engineering and has been applied with great effect to a very broad and diverse range of problems. It was not formalized as a general technique until the beginning of the twentieth century, when the eminent mathematical physicist Lord Rayleigh wrote a provocative and highly influential paper in the journal Nature titled “The Principle of Similitude.”16 This was his term for what we have been calling scaling theory. His major emphasis was on the primary role played in any physical system by special quantities that have the property of being dimensionless.
Similarly, the distance between London and Manchester can be expressed as either 278 miles or 456 kilometers. However, the ratio of the distance from New York to Los Angeles to that of London to Manchester (either 3,210 miles ÷ 278 miles, or 5,871 kilometers ÷ 456 kilometers) is the same (14.89) regardless of what units are used. This is the simplest example of a dimensionless quantity: it is a “pure” number that does not change when a different system of units is used to measure it. This scale invariance expresses something absolute about the quantities they represent in that the dependence on the arbitrariness of the human choice of units and measurement has been removed.
Using an elegant argument based solely on relating purely dimensionless quantities, he shows that the intensity of light waves scattered by small particles must decrease with the fourth power of their wavelength. Thus, when sunlight, which is a combination of all of the colors of the rainbow, scatters from microscopic particles suspended in the atmosphere, the shortest wavelengths, corresponding to blue light, dominate.
Rayleigh had derived this stunning result much earlier in a tour de force based on a masterful mathematical analysis of the problem that provided a detailed mechanistic explanation for the origin of the shift toward the blue end of the spectrum. His point in presenting the simple derivation in his similitude paper was to show that the same result could have been derived “after a few minutes’ consideration,” as he put it, using a scaling argument in the guise of the “great principle of similitude” without the detailed sophisticated mathematics. His scaling argument showed that the shift to shorter wavelengths is an inevitable outcome of any analysis once you know what the important variables are. What is missing from such a derivation is a deeper understanding of the mechanism by which the result comes about. This is characteristic of many scaling arguments: general results can be derived, but details of their mechanistic origins sometimes remain hidden.
Is it conceivable that there are yet-to-be-discovered “Newton’s Laws of Biology” that would lead, at least in principle, to precise calculations of any biological process so that, for instance, one could accurately predict how long you and I would live?
This seems very unlikely. After all, life is the complex system par excellence, exhibiting many levels of emergent phenomena arising from multiple contingent histories. Nevertheless, it may not be unreasonable to conjecture that the generic coarse-grained behavior of living systems might obey quantifiable universal laws that capture their essential features. This more modest view presumes that at every organizational level average idealized biological systems can be constructed whose general properties are calculable.
Even the most arrogant hard-nosed physicist had a hard time disagreeing with the sentiment that biology would very likely eclipse physics as the dominant science of the twenty-first century. But what incensed many of us was the implication, oftentimes explicit, that there was no longer any need for further basic research in this kind of fundamental physics because we already knew all that was needed to be known.
My visceral reaction to the provocative statements concerning the diverging trajectories of physics and biology was that, yes, biology will almost certainly be the predominant science of the twenty-first century, but for it to become truly successful, it will need to embrace some of the quantitative, analytic, predictive culture that has made physics so successful. Biology will need to integrate into its traditional reliance on statistical, phenomenological, and qualitative arguments a more theoretical framework based on underlying mathematizable or computational principles. I am embarrassed to say that I knew very little about biology at that time, and this outburst came mostly from arrogance and ignorance.
to understand how something ages and dies, whether an animal, an automobile, a company, or a civilization, one first needs to understand what the processes and mechanisms are that are keeping it alive, and then discern how these become degraded with time. This naturally leads to considerations of the energy and resources that are required for sustenance and possible growth, and their allocation to maintenance and repair for combating the production of entropy arising from destructive forces associated with damage, disintegration, wear and tear, and so on. This line of thinking led me to focus initially on the central role of metabolism in keeping us alive before asking why it can’t continue doing so forever.
Metabolic rate is the fundamental rate of biology, setting the pace of life for almost everything an organism does, from the biochemical reactions within its cells to the time it takes to reach maturity, and from the rate of uptake of carbon dioxide in a forest to the rate at which its litter breaks down.
metabolic rate exhibits an extraordinarily systematic regularity across all organisms.
metabolic rate scales with body size in the simplest possible manner one could imagine when plotted logarithmically against mass, namely, as a straight line indicative of a simple power law scaling relationship.
The scaling of metabolic rate has been known for more than eighty years. Although primitive versions of it were known before the end of the nineteenth century, its modern incarnation is credited to the distinguished physiologist Max Kleiber, who formalized it in a seminal paper published in an obscure Danish journal in 1932.5 I was quite excited when I first came across
Remarkably, and of equal importance, the same scaling has been shown to be valid across all multicellular taxonomic groups including fish, birds, insects, crustacea, and plants, and even to extend down to bacteria and other unicellular organisms.
it encompasses an astonishing twenty-seven orders of magnitude, perhaps the most persistent and systematic scaling law in the universe.
More generally: if the mass is increased by any arbitrary factor at any scale (100, in the example), then the metabolic rate increases by the same factor (32, in the example) no matter what the value of the initial mass is, that is, whether it’s that of a mouse, cat, cow, or whale. This remarkably systematic repetitive behavior is called scale invariance or self-similarity and is a property inherent to power laws. It is closely related to the concept of a fractal,
the exponent for growth rates is very close to ¾, for lengths of aortas and genomes it’s ¼, for heights of trees ¼, for cross-sectional areas of both aortas and tree trunks ¾, for brain sizes ¾, for cerebral white and gray matter 5⁄4, for heart rates minus ¼, for mitochondrial densities in cells minus ¼, for rates of evolution minus ¼, for diffusion rates across membranes minus ¼, for life spans ¼ . . . and many, many more. The “minus” here simply indicates that the corresponding quantity decreases with size rather than increases, so, for instance, heart rates decrease with increasing body size following the ¼ power law, as shown in Figure 10. I can’t resist drawing your attention to the intriguing fact that aortas and tree trunks scale in the same way.
For example, the radii and lengths of tree trunks, or for that matter the limbs of animals, scale differently from one another as size increases: radii scale as the ⅜ power of mass, whereas lengths scale more slowly with ¼ power
Consequently, trunks and limbs become more thickset and stockier as the size of a tree or animal increases; just think of an elephant’s legs relative to those of a mouse.
Huxley’s term allometric was extended from its more restrictive geometric, morphological, and ontogenetic origins to describe the kinds of scaling laws that I discussed above, which include more dynamical phenomena such as how flows of energy and resources scale with body size, with metabolic rate being the prime example. All of these are now commonly referred to as allometric scaling
At any one time our bodies contain only about half a pound (about 250 g) of ATP, but here’s something truly extraordinary that you should know about yourself: every day you typically make about 2 × 1026 ATP molecules—that’s two hundred trillion trillion molecules—corresponding to a mass of about 80 kilograms (about 175 lbs.)
each day you produce and recycle the equivalent of your own body weight of ATP! Taken together, all of these ATPs add up to meet our total metabolic needs at the rate of the approximately 90 watts we require to stay alive and power our bodies.
So on average each cell in your body may have up to a million of these little engines distributed among its mitochondria working away night and day, collectively manufacturing the astronomical number of ATPs needed to keep you viable, healthy, and strong. The rate at which the total number of these ATPs is produced is a measure of your metabolic rate.
Just as organisms are constrained by the integration of the emergent laws operating at the cellular, mitochondrion, and respiratory complex levels, so cities have emerged from, and are constrained by, the underlying emergent dynamics of social interactions. Such laws are not “accidents” but the result of evolutionary processes acting across multiple integrated levels of structure.
NETWORKS AND THE ORIGINS OF QUARTER-POWER ALLOMETRIC SCALING
Natural selection has solved this challenge in perhaps the simplest possible way by evolving hierarchical branching networks that distribute energy and materials between macroscopic reservoirs and microscopic sites.
biological systems are ultimately constrained by the rates at which energy, metabolites, and information can be supplied through these networks.
Physicists have coined a concept to help formalize a first step in this approach, which they call a “toy model.” The strategy is to simplify a complicated system by abstracting its essential components, represented by a small number of dominant variables, from which its leading behavior can be determined.
it provided the point of departure for developing our modern, significantly more detailed and precise understanding
A concept related to the idea of a toy model is that of a “zeroth order” approximation of a theory, in which simplifying assumptions are similarly made in order to give a rough approximation of the exact
employed in a quantitative context as, for example, in the statement that “a zeroth order estimate for the population of the Chicago metropolitan area in 2013 is 10 million people.”
Upon learning a little more about Chicago, one might make what could be called a “first order” estimate of its population of 9.5 million, which is more precise and closer to the actual number
One could imagine that after more detailed investigation, an even better estimate would yield 9.54 million, which would be called a “second order” estimate.
each succeeding “order” represents a refinement, an improved approximation, or a finer resolution that converges to the exact result based on more detailed investigation and analysis.
Could we first construct a coarse-grained zeroth order theory for understanding the plethora of quarter-power allometric scaling relations based on generic underlying principles that would capture the essential features of organisms? And could we then use it as a point of departure for quantitatively deriving more refined predictions, the higher order corrections, for understanding the dominant behavior of real biological systems?
“technology gives us the tools to analyze organisms at all scales, but we are drowning in a sea of data and thirsting for some theoretical framework with which to understand it. . . . We need theory and a firm grasp on the nature of the objects we study to predict the rest.”
because the structures of biological networks are so varied and stand in marked contrast to the uniformity of the scaling laws, their generic properties must be independent of their specific evolved design.
there must be a common set of network properties that transcends whether they are constructed of tubes as in mammalian circulatory systems, fibers as in plants and trees, or diffusive pathways as in cells.
As is often the case when moving into uncharted territory and trying to develop new ideas and ways of looking at a problem, the final product seems so obvious once the discovery or breakthrough has been made. It’s hard to believe that it took so long, and one wonders why it couldn’t have been done in just a few days. The frustrations and inefficiencies, the blind alleys, and the occasional eureka moments
As is often the case when moving into uncharted territory and trying to develop new ideas and ways of looking at a problem, the final product seems so obvious once the discovery or breakthrough has been made. It’s hard to believe that it took so long, and one wonders why it couldn’t have been done in just a few days. The frustrations and inefficiencies, the blind alleys, and the occasional eureka moments are all part and parcel of the creative process.
we proposed the following set of generic network properties that are presumed to have emerged as a result of the process of natural selection and which give rise to quarter-power scaling laws when translated into mathematics.
I. Space Filling
Roughly speaking, it means that the tentacles of the network have to extend everywhere throughout the system that it is serving,
More specifically: whatever the geometry and topology of the network is, it must service all local biologically active subunits of the organism or subsystem.
Quite analogously, many of the infrastructural networks in cities are also space filling: for example, the terminal units or end points of the utility networks—gas, water, and electricity—have to end up supplying all of the various buildings that constitute a city.
II. The Invariance of Terminal Units
This simply means that the terminal units of a given network design, such as the capillaries of the circulatory system that we just discussed, all have approximately the same size and characteristics regardless of the size of the organism.
As individuals grow from newborn to adult, or as new species of varying sizes evolve, terminal units do not get reinvented nor are they significantly reconfigured or rescaled. For example, the capillaries of all mammals, whether children, adults, mice, elephants, or whales, are essentially all the same despite the enormous range and variation of body sizes.
The invariant properties of the terminal units within a specific design characterize the taxonomic class.
For instance, all mammals share the same capillaries. Different species within that class such as elephants, humans, and mice are distinguished from one another by having larger or smaller, but closely related, network configurations.
Analogously, the terminal units of networks that service and sustain buildings in a city, such as electrical outlets or water faucets, are also approximately invariant. For example, the electrical outlets in your house are essentially identical to those of almost any building anywhere in the world, no matter how big or small it is.
III. Optimization
The final postulate states that the continuous multiple feedback and fine-tuning mechanisms implicit in the ongoing processes of natural selection and which have been playing out over enormous periods of time have led to the network performance being “optimized.” So, for example, the energy used by the heart of any mammal, including us, to pump blood through the circulatory system is on average minimized. That is, it is the smallest it could possibly be given its design and the various network constraints.
To put it slightly differently: of the infinite number of possibilities for the architecture and dynamics of circulatory systems that could have evolved, and that are space filling with invariant terminal units, the ones that actually did evolve and are shared by all mammals minimize cardiac output. Networks have evolved so that the energy needed to sustain an average individual’s life and perform the mundane tasks of living is minimized in order to maximize the amount of energy available for sex, reproduction, and the raising of offspring.
This naturally raises the question as to whether the dynamics and structure of cities and companies are the result of analogous optimization principles. What, if anything, is optimized in their multiple network systems? Are cities organized to maximize social interactions, or to optimize transport by minimizing mobility times, or are they ultimately driven by the ambition of each citizen and company to maximize their assets, profits, and wealth? I will return to these issues in chapters 8, 9, and 10.
Optimization principles lie at the very heart of all of the fundamental laws of nature, whether Newton’s laws, Maxwell’s electromagnetic theory, quantum mechanics, Einstein’s theory of relativity, or the grand unified theories of the elementary particles. Their modern formulation is a general mathematical framework in which a quantity called the action, which is loosely related to energy, is minimized. All the laws of physics can be derived from the principle of least action which, roughly speaking, states that, of all the possible configurations that a system can have or that it can follow as it evolves in time, the one that is physically realized is the one that minimizes its action.
It may have occurred to you that there must be variation among the almost trillion capillaries in any individual human body, as there must be across all the species of a given taxonomic group, so strictly speaking capillaries cannot be invariant. However, this variation has to be viewed in a relative scale-dependent way. The point is that any variation among capillaries is extremely small compared with the many orders of magnitude variation in body size.
For instance, even if the length of mammalian capillaries varied by a factor of two, this is still tiny compared with the factor of 100 million in the variation of their body masses. Similarly, there is relatively little variation in petioles, the last branch of a tree prior to the leaf, or even in the size of leaves themselves, during the growth of a tree from a tiny sapling to a mature tree that might be a hundred or more feet high.
Consequently, the variation among terminal units within a given design is a relatively small secondary effect.
These postulates underlie the zeroth order, coarse-grained theory for the structure, organization, and dynamics of biological networks, and allow us to calculate many of the essential features of what I referred to as the average idealized organism of a given size. In order to carry out this strategy and calculate quantities such as metabolic rates, growth rates, the heights of trees, or the number of mitochondria in a cell, these postulates have to be translated into mathematics. The goal is to determine the consequences, ramifications, and predictions of the theory and confront them with data and observations.
our circulatory system is a network of pipes driven by a beating heart, whereas plants and trees are networks of bundles of thin fibers driven by a steady nonpulsatile hydrostatic pressure. Fundamental to the conceptual framework of the theory is that, despite these completely different physical designs, both kinds of networks are constrained by the same three postulates: they are space filling, have invariant terminal units, and minimize the energy needed to pump fluid through the system.
oxygen is crucial for maintaining the continuous supply of ATP molecules that are the basic currency of the metabolic energy that keeps us alive—that’s why we have to be continuously breathing. Inhaled oxygen is transported across the surface membranes of our lungs, which are suffused with capillaries, where it is absorbed by our blood and pumped through the cardiovascular system to be delivered to our cells.
Oxygen molecules bind to the iron-rich hemoglobin in blood cells, which act as the carriers of oxygen. It is this oxidation process that is responsible for our blood being red in much the same way that iron turns red when it oxidizes to rust in the atmosphere. After the blood has delivered its oxygen to the cells, it loses its red color and turns bluish, which is why veins, which are the vessels that return blood back to the heart and lungs, look blue.
The rate at which oxygen is delivered to cells and likewise the rate at which blood is pumped through our circulatory system are therefore measures of our metabolic
The rate at which oxygen is delivered to cells and likewise the rate at which blood is pumped through our circulatory system are therefore measures of our metabolic rate.
Similarly, the rate at which oxygen is inhaled through our mouths and into the respiratory system is also a measure of metabolic rate.
These two systems are tightly coupled together so blood flow rates, respiratory rates, and metabolic rates are all proportional to one another and related by simple linear relationships. Thus, hearts beat approximately four times for each breath that is inhaled, regardless of the size of the mammal.
A human aorta is an approximately cylindrical pipe that is about 18 inches long (about 45 cm) and about an inch (about 2.5 cm) in diameter, whereas our capillaries are only about 5 micrometers wide (about a hundredth of an inch), which is somewhat smaller than a hairbreadth.13 Although a blue whale’s aorta is almost a foot in diameter (30 cm), its capillaries are still pretty much the same size as yours and mine. This is an explicit example of the invariance of the terminal units in these networks.
One of the basic postulates of our theory is that the network configuration has evolved to minimize cardiac output, that is, the energy needed to pump blood through the system.
the blood wave traveling along the aorta is partially reflected back when it meets the branch point, the remainder being transmitted down through the daughter arteries. These reflections have potentially very bad consequences because they mean that your heart is effectively pumping against itself. Furthermore, this effect gets hugely enhanced as blood flows down through the hierarchy of vessels because the same phenomenon occurs at each ensuing branch point in the network, resulting in a large amount of energy being expended by your heart just in overcoming these multiple reflections. This would be an extremely inefficient design, resulting in a huge burden on the heart and a huge waste of energy.
To avoid this potential problem and minimize the work our hearts have to do, the geometry of our circulatory systems has evolved so that there are no reflections at any branch point throughout the network. The mathematics and physics of how this is accomplished is a little bit complicated, but the result is simple and elegant: the theory predicts that there will be no reflections at any branch point if the sum of the cross-sectional areas of the daughter tubes leaving the branch point is the same as the cross-sectional area of the parent tube coming into it.
This so-called area-preserving branching is, indeed, how our circulatory system is constructed, as has been confirmed by detailed measurements across many mammals—and many plants and trees.
This condition of nonreflectivity is called impedance matching.
Without the gel, the impedance mismatch in ultrasound detection would result in almost all of the energy being reflected back from the skin, leaving very little to go into the body to be reflected back from the organ or fetus under investigation.
As blood flows through smaller and smaller vessels on its way down through the network, viscous drag forces become increasingly important, leading to the dissipation of more and more energy. The effect of this energy loss is to progressively dampen the wave on its way down through the network hierarchy until it eventually loses its pulsatile character and turns into a steady flow.
by the time blood reaches the capillaries its viscosity ensures that it is no longer pulsatile and that it is moving extremely slowly. It slows down to a speed of only about 1 millimeter per second, which is tiny compared with its speed of 40 centimeters per second when it leaves the heart. This is extremely important because this leisurely speed ensures that oxygen carried by the blood has sufficient time to diffuse efficiently across the walls of the capillaries and be rapidly delivered to feed cells.
the theory predicts that these velocities at the two extremities of the network, the capillaries and the aorta, are the same for all mammals,
what’s really surprising is that blood pressures are also predicted to be the same across all mammals, regardless of their size.
This is pretty amazing—just think of the enormous stresses on the walls of the shrew’s tiny aorta and arteries compared with the pressures on yours or mine, let alone those on a whale’s. No wonder the poor creature dies after only a year or two. The
as we age, our arteries harden, leading to significant changes in their density and elasticity, and therefore to predictable changes in the flow and pulse velocity of the blood.
Most biological networks like the circulatory system exhibit the intriguing geometric property of being a fractal.
Simply put, fractals are objects that look approximately the same at all scales or at any level of magnification.
So, for example, if we compare the radii of vessels separated by 10 such branchings, then they are related by a scale factor of (√2)10 = 32. Because our aorta has a radius of about 1.5 centimeters, this means that the radii of vessels at the tenth branching level are only about half a millimeter.
Because blood flow changes from pulsatile to nonpulsatile as one progresses down the network, our circulatory system is actually not continuously self-similar nor therefore a precise fractal. In the nonpulsatile domain where the flow is dominated by viscous forces, minimizing the amount of power being dissipated leads to a self-similarity in which the radii of successive vessels decrease by a constant factor of the cube root of two 3√2 (= 1.26 . . .), rather than the square root √2 (= 1.41 . . .) as in the pulsatile region. Thus the fractal nature of the circulatory system subtly changes from the aorta to the capillaries, reflecting the change in the nature of the flow from pulsatile to nonpulsatile.
a further consequence of the energy minimization principle: namely, that the total volume of the network—that is, the total volume of blood in the body—must be directly proportional to the volume of the body itself, and therefore proportional to its weight,
In other words, the volume of blood is a constant proportion of the volume of the body, regardless of size.
the volume of the network is just the sum of the volumes of all of its vessels or branches, and these can be straightforwardly calculated from knowing how their lengths and radii scale, thereby connecting the self-similarity of the internal network to body size. It is the mathematical interplay between the cube root scaling law for lengths and the square root scaling law for radii, constrained by the linear scaling of blood volume and the invariance of the terminal units, that leads to quarter-power allometric exponents across organisms.
The resulting magic number four emerges as an effective extension of the usual three dimensions of the volume serviced by the network by an additional dimension resulting from the fractal nature of the network. I
general concept of fractal dimension,
More generally, it is the dimension of the space being serviced plus one. So had we lived in a universe of eleven dimensions, as some of my string theory friends believe, the magic number would have been 11 + 1 = 12, and
Mandelbrot did not get his first tenured professorial appointment until he was seventy-five years old, thereby becoming the oldest professor in Yale’s history to receive tenure. Perhaps it requires outliers and mavericks like Richardson and Mandelbrot working outside mainstream research to revolutionize our way of seeing the world.
When he plotted the number of deadly quarrels of a given size versus their magnitude on a logarithmic scale, he found an approximately straight line
the South African coast is very close to being a smooth line because its fractal dimension is 1.02, which is very close to 1, whereas Norway is far from it because its fractal dimension of 1.52 is so much greater than 1. You could imagine an extreme case of this in which the line is so crinkly and convoluted that it effectively fills an entire area. Consequently, even though it’s still a line with “ordinary” dimensions 1, it behaves as if it were an area in terms of its scaling properties, therefore having a fractal dimension of 2. This curious gain of an effective additional dimension is a general feature of space-filling curves, to which I will return in the next chapter.
In contrast to Richardson, Mandelbrot had been educated in the more formal tradition of classical French mathematics and was familiar with the strange world of abstract, densely crinkled, non-Euclidean curves and surfaces. His great contribution was to see that what Richardson had discovered could be put on a firm mathematical basis and that the weird geometries that academic mathematicians had been playing with
he realized that these ideas are generalizable far beyond considerations of borders and coastlines to almost anything that can be measured, even including times and frequencies. Examples include our brains, balls of crumpled paper, lightning, river networks, and time series like electrocardiograms (EKGs) and the stock market.
Healthy hearts have relatively high fractal dimensions, reflecting more spiky and ragged EKGs, whereas diseased hearts have low values with relatively smooth EKGs. In fact, those that are most seriously at risk have fractal dimensions close to one with an uncharacteristically smooth EKG. Thus the fractal dimension of the EKG provides a potentially powerful complementary diagnostic tool for quantifying heart disease and health.
being healthy and robust equates with greater variance and larger fluctuations, and therefore a larger fractal dimension as in an EKG, is closely related to the resilience of such systems.
the same set of network principles leads to similar scaling laws in systems with very different evolved designs. Not only do they explain the origin of ubiquitous quarter-power scaling across different taxonomic groups but they also show, for instance, why aortas scale in the same way as tree trunks.
in addition to minimizing energy loss, natural selection has also led to a maximization of metabolic capacity because metabolism produces the energy and materials required to sustain and reproduce life.
This has been achieved by maximizing surface areas across which resources and energy are transported. These surfaces are in actuality the total surface areas of all the terminal units of the network.
Natural selection has taken advantage of the fractal nature of space-filling networks to maximize the total effective surface area of these terminal units and thereby maximize metabolic output. Geometrically, the nested levels of continuous branching and crenulations inherent in fractal-like structures optimize the transport of information, energy, and resources by maximizing the surface areas across which these essential features of life flow.
Because of their fractal nature, these effective surface areas are very much larger than their apparent physical size.
Even though your lungs are only about the size of a football with a volume of about 5 to 6 liters (about one and a half gallons), the total surface area of the alveoli, which are the terminal units of the respiratory system where oxygen and carbon dioxide are exchanged with the blood, is almost the size of a tennis court and the total length of all the airways is about 2,500 kilometers, almost the distance from Los Angeles to Chicago, or London to Moscow.
driven by the forces of natural selection to maximize exchange surfaces, biological networks do achieve maximal space filling and consequently scale like three-dimensional volumes rather than two-dimensional Euclidean surfaces.
This additional dimension, which arises from optimizing network performance, leads to organisms’ functioning as if they are operating in four dimensions. This is the geometric origin of the quarter power. Thus, instead of scaling with classic ⅓ exponents, as would be the case if they were smooth nonfractal Euclidean objects, they scale with ¼ exponents. Although living things occupy a three-dimensional space, their internal physiology and anatomy operate as if they were four-dimensional.
almost none of our man-made engineered artifacts and systems, whether automobiles, houses, washing machines, or television sets, invoke the power of fractals to optimize performance. To a very limited extent, electronic equipment such as computers and smart phones does, but compared with how you work they are extraordinarily primitive. On the other hand, human-engineered systems that have grown organically such as cities, and to a limited extent corporations, have unconsciously evolved self-similar fractal structures which have tended to optimize their performance. More on this in chapters 8 and 9.
Idealized mathematical fractals continue “forever.” The repetitive self-similarity persists ad infinitum unbounded from the infinitesimally small to the infinitely large. But in real life there are clear limits.
Unlike most biological networks, mammalian circulatory systems are not single self-similar fractals but an admixture of two different ones, reflecting the change in flow from predominantly pulsatile AC to predominantly nonpulsatile DC as blood flows from the aorta to the capillaries. Most of the blood resides in the larger vessels of the upper part of the network where AC dominates, leading to the ¾ power scaling law for metabolic rates.
all mammals have roughly the same number of branching levels, about fifteen, where the flow is predominantly steady nonpulsatile DC.
The distinction among mammals as their size increases is the increasing number of levels where the flow is pulsatile AC. For example, we have about seven to eight, the whale has about sixteen to seventeen, and the shrew just one or two. Impedance matching in these vessels ensures that relatively little energy is required to pump blood through them, so the more of them you have the better.
Relatively speaking, then, the proportion of the network where the heart expends most of its energy systematically decreases as the size of a mammal increases, illustrating again that larger mammals are more efficient than smaller ones: the whale needs only one hundredth the amount of energy needed by a shrew to supply blood to one of its cells. Mammals range in size from the 2 gm shrew (top right) to the 20,000 kg blue whale.
imagine continuously decreasing the size of the animal. Concomitantly, the number of area-preserving branchings where vessels are large enough to support pulsatile waves decreases until a tipping point is reached where the network can support only nonpulsatile DC flow.
Such an animal would have a beating heart but no pulse! This is not only weird, but more important, it would be an extremely inefficient design because it would have entirely lost the advantages of impedance matching and would lead to significant energy being dissipated in all of the vessels throughout its circulatory system.
only mammals that are large enough for their circulatory systems to support pulsatile waves through at the very least the first couple of branching levels would have evolved, thereby providing a fundamental reason why there is a minimum size.3 The theory can be used to derive a formula for when this tipping point occurs.
Its actual value depends upon generic quantities such as the density and viscosity of blood and the elasticity of arterial walls. The calculation leads to an approximate value for the size of the smallest mammal of just a couple of grams, comparable to the mass of the Etruscan shrew, which is the smallest known mammal. It is only about 4 centimeters long, easily sitting on the palm of your hand. Its tiny heart beats at more than a thousand times a minute—about twenty times a second—as it pumps blood with the same pressure and speed as you do, and even more astounding, as does a blue whale. And all of this through its minuscule aorta, which is only a couple of millimeters long and an astonishingly couple of tenths of a millimeter wide, not much thicker than a hairbreadth. As I have remarked earlier, no wonder the poor creature doesn’t live very long.
The greatest mechanical stresses occur during movement and especially during running, which is an essential feature of survival for many animals.
there are additional constraints on maximum body size that transcend ecological biomechanics and that arise from the fundamental need to ensure that all cells are supplied with sufficient oxygen.
One of the more arcane results of the network theory is that the average distance between terminal units such as capillaries scales with body mass as a power law with an exponent of 1/12 (= 0.0833 . . .). This is an unusually small exponent that represents an exceedingly slow variation with body size, leading to the network very gradually opening up and becoming sparser as size increases,
although a blue whale is a hundred million times (108) heavier than a shrew, the average distance between its capillaries is only about (108)1/12 = 4.6 times larger.
Capillaries service cells, so the opening up of the network means that there is increasingly more tissue that needs to be serviced situated between adjacent capillaries as size increases. So on average, each capillary systematically has to service more cells, another reflection of the increasing economy of scale discussed earlier. However, there is a limit to how far this can be pushed. Each capillary, being an invariant unit, can deliver only so much oxygen to the tissue. So if the group of cells needing to be supplied by a single capillary becomes too large, some of them will inevitably become oxygen deprived,
Danish physiologist August Krogh, who received a Nobel Prize for his work. He recognized that there is a limit to how far oxygen can diffuse before there isn’t sufficient left to sustain the cells that are too far away. This distance is known as the maximal Krogh radius, which is the radius of an imaginary cylinder surrounding the length of a capillary, like a sheath, and which contains all of the cells that can be sustained (just to remind you: a capillary is about half a millimeter long and about five times longer than its diameter).
There is, however, one human invention that has evolved via this process which is comparable to what traditional natural selection has thus far produced, and that is the city. Cities clearly have an organic nature and share much in common with traditional organisms. They metabolize, they grow, they evolve, they sleep, they age, they contract disease, suffer damage and repair themselves, and so on. On the other hand, they rarely reproduce nor do they easily die.
Growth cannot happen without a continuous supply of energy and resources. You eat, you metabolize, you transport metabolic energy through networks to your cells, where some is allocated to the repair and maintenance of existing cells, some to replace those that have died, and some to create new ones that add to your overall biomass.
This sequence of events is the template for how all growth occurs, whether for an organism, a city, a company, or even an economy,
want to focus on ontogenetic growth and show how the network theory naturally leads to a quantitative derivation of how the weight of an organism changes with its age and, in particular, explains why we stop growing.
All mammals and many other animals share the same kind of growth trajectory that we follow, called determinate growth by biologists to distinguish it from indeterminate growth, typically observed in fish, plants, and trees, where growth continues indefinitely until death.
Suppose the size of the organism doubles; then the number of cells also doubles, so the amount of energy needed for their maintenance increases by a factor of 2. However, metabolic rate (the supply of energy) increases by only a factor of 2^(¾) = 1.682 . . . which is less than 2. So the rate at which energy is needed for maintenance increases faster than the rate at which metabolic energy can be supplied, forcing the amount of energy available for growth to systematically decrease and eventually go to zero, resulting in the cessation of growth. In other words, you stop growing because of the mismatch between the way maintenance and supply scale as size increases.
The theory tells us how to rescale the spatial and temporal dimensions of animals so that they all appear to grow in the same way and at the same rate. Growth trajectories of a broad sampling of diverse mammals, birds, fish, and crustacea with very different body designs and life spans all collapse onto a single curve whose mathematical form is predicted by the theory. As you can see, this is beautifully supported by the data and graphically reveals the hidden commonality and unity underlying the ontogeny of all animals. And the theory tells us why: growth is primarily determined by how energy is delivered to cells, and this is constrained by universal properties of networks that transcend design.
The theory has been extended to understand the growth of tumors, plants, insects, and both forest5 and social insect communities6 such as ants and bees. These latter applications are forerunners of how we might start thinking about the growth of human organizations such as cities and companies,
analytic models such as the growth theory are deliberate oversimplifications of a more complex reality. Their utility depends on the extent to which they capture some fundamental essence of how nature works, the extent to which their assumptions are reasonable, their logic sound, and their simplicity or explanatory power and internal consistency in agreement with observations. Because the theory is deliberately simplified, it is inevitable that measurements of real organisms will, to varying degrees, deviate from model predictions.
sublinear scaling and the associated economies of scale arising from optimizing network performance lead to bounded growth and the systematic slowing of the pace of life.
temperature plays a huge role across all of life.
this sensitivity to temperature is exponential. The reason for this sensitivity is that all chemical reaction rates depend exponentially on temperature.
metabolic rate scales exponentially with temperature rather than as a power law as it does with mass. Because metabolic rate—the rate at which energy is supplied to cells—is the fundamental driver of all biological rates and times, all of the central features of life from gestation and growth to mortality are exponentially sensitive to temperature.
across the spectrum of life all biological rates and times such as those associated with growth, embryonic development, longevity, and evolutionary processes are determined by a joint universal scaling law in terms of just two parameters: the number ¼, arising from the network constraints that control the dependence on mass, and 0.65 eV, originating in the chemical reaction dynamics of ATP production. This result can be restated in a slightly different way: when adjusted for size and temperature, as determined by just these two numbers, all organisms run to a good approximation by the same universal clock with similar metabolic, growth, and evolutionary rates.
at a deep level, birth, growth, and death are all governed by the same underlying dynamics driven by metabolic rate and encapsulated in the dynamics and structure of networks.
for every 10°C rise in temperature the production rate doubles. Consequently, a relatively small increase of only 10°C leads to a doubling of metabolic rate and therefore to a doubling of the rate of living.
a modest 2°C change in ambient temperature leads to a 20 percent to 30 percent change in growth and mortality rates. This is huge and therein lies our problem. If global warming induces a temperature increase of around 2°C, which it is on track to do, then the pace of almost all biological life across all scales will increase by a whopping 20 percent to 30 percent. This is highly nontrivial and will potentially wreak havoc with the ecosystem.
in England, where some of the best mortality statistics have been kept since the sixteenth century, the average life span remained at roughly thirty-five years from about 1540 to about 1840, when it began to rise, reaching fifty-two in 1914, the year my father was born, then to about sixty-three in 1940, the year I was born, and has now climbed to more than eighty-one years.
deconstruct mortality into its leading medical causes. In order, these are (1) cardiovascular and heart disease, (2) cancer (malignant neoplasms), (3) respiratory disease, and (4) stroke (cerebrovascular diseases). The pattern is quite similar across the globe.
if all heart and cardiovascular disease were cured, life expectancy at birth would increase by only about six years. Perhaps more surprising is to learn that if all cancer were cured, life expectancy at birth would increase by only about three years—and, at age sixty-five, only by a little less than two years.
(1) The leading causes of death are overwhelmingly associated with damage, whether in organs and tissue (as in heart attacks or stroke) or in molecules (as in cancer)—infectious diseases play a relatively minor role. (2) Even if every cause of death were eliminated, all human beings are destined to die before they reach 125 years old, and the vast majority of us will do so well before we reach that ripe old age.
Aging and death are “universal”: all organisms eventually die. A corollary to this is that there is a maximum life span and a corresponding vanishing survival rate. Semiautonomous subsystems of organisms, such as our various organs, age approximately uniformly. Aging progresses approximately linearly with age.
Life spans scale with body mass as a power law whose exponent is approximately ¼. As anticipated, there is a large variance in the data, partly because there are no controlled life-history experiments on longevity for mammals, including us. Some of the data are garnered from reports on wild animals, some from zoos, some from domesticated animals, some from research laboratories, each with very different environmental and lifestyle conditions. In addition, some are reports of just one or two animals of a species, and some from large cohorts. Although this lack of control is problematic, there are clear trends and consistencies in the data that statistically point to approximate ¼ power scaling.
The number of heartbeats in a lifetime is approximately the same for all mammals,
The greatest outlier from this intriguing invariance is us: for modern human beings, on average our hearts beat approximately two and a half billion times, which is about twice the number for a typical mammal.
Related to this is another invariant quantity: the total amount of energy used in a lifetime to support a gram of tissue is approximately the same for all mammals and, more generally, for all animals within a specific taxonomic group.
the number of turnovers during a lifetime of the respiratory machinery responsible for the production of energy in cells is approximately the same for all animals within a specific taxonomic group.
Damage occurs across multiple scales through many different mechanisms associated with physical or chemical transport phenomena, but loosely speaking it can be separated into two categories: (1) Classic physical wear and tear due to the viscous drag in the flow, analogous to the wear and tear resulting from ordinary friction when two physical objects move over each other like wearing out your shoes or the tires of your car.
(2) Chemical damage from free radicals, which are by-products of the production of ATP in respiratory metabolism. A free radical is any atom or molecule that has lost an electron and consequently has a positive electric charge, making it highly volatile. Most of this kind of damage is caused by oxygen radicals that react with vital cellular components. Oxidative damage to DNA may be particularly deleterious, because in nonreplicating cells such as in the brain and musculature, it causes permanent damage to transcriptional, and perhaps most important, regulatory regions of the genome.
The details of the damage mechanism are not important for understanding many of the general features of aging and mortality because the most relevant damage occurs in invariant terminal units of networks (capillaries and mitochondria, for example) whose properties do not appreciably change with the size of the organism. Consequently, the damage per capillary or mitochondrion is approximately the same regardless of the animal.
Because larger animals metabolize at higher rates following the ¾ power scaling law, they suffer greater production of entropy and therefore greater overall damage, so you might have thought that this would imply that larger animals would have shorter life spans in obvious contradiction to observation. However, we saw in chapter 3 that on a cellular or per unit mass of tissue basis metabolic rate and therefore the rate at which damage is occurring at the cellular and intracellular levels decreases systematically with increasing size of the animal—another
the most significant damage occurs at the terminal units of networks in capillaries, mitochondria, and cells, and their metabolic rates decrease with the size of the organism following power law scaling with an exponent of ¼.
Cells in larger animals are systematically processing energy at a slower rate than cells in smaller ones.
So at the critical cellular level cells suffer systematically less damage at a slower rate the larger the animal, and this results in a correspondingly longer life span.
Because terminal units are invariant, the total damage rate is just proportional to their total number and so also increases only as the ¾ power of mass and is therefore directly proportional to metabolic rate.
Repair is expensive, and faithfully repairing every single damage event is prohibitively expensive, if not impossible given the enormous number of damages that are continually occurring. The overall scale of repair is primarily determined by the evolutionary requirement that organisms live long enough to produce sufficient offspring to compete in the gene pool.
Aging therefore progresses approximately uniformly, gradually leading to the onset of mortality. This is the result of cumulative unrepaired damage having become sufficiently macroscopic that the functionality of the organism is increasingly compromised,
The total number of damages incurred in a lifetime is just the damage rate (that is, the number of damage events per unit time which is proportional to the number of terminal units) multiplied by the life span, and this has to be proportional to the total number of cells, and therefore to body mass.
life span is proportional to the total number of cells divided by the number of terminal units. But the number of terminal units scales with mass with a ¾ power exponent, while the number of cells scales linearly, resulting in life span scaling as the ¼ power of mass, consistent with data.
life span is inversely proportional to the metabolic rate per unit mass of the organism and therefore inversely proportional to the average metabolic rate of its cells. We saw just above when discussing the metabolic theory of ecology that this systematically scales with body mass following quarter-power scaling and as an exponential with temperature.
life spans systematically and predictably increase exponentially as temperature decreases,
life span can in principle be extended by lowering the body temperature because this lowers cellular metabolic rate and therefore the rate at which damage is incurred. This is a very large effect: I remind you that a modest 2°C decrease in body temperature can result in a 20 percent to 30 percent increase in life span.
B. HEARTBEATS AND THE PACE OF LIFE:
C. CALORIC RESTRICTION AND EXTENDING LIFE SPAN:
within species an individual like each of us can decrease its cellular metabolic rate simply by eating less, resulting in less metabolic damage per cell and potentially in an increase in its life span. This strategy is called caloric restriction.
Roughly speaking, the theory predicts that maximum life span, and by extrapolation average life span, increases inversely with caloric intake.
the doubling time of the global population has actually been getting systematically shorter and shorter as was indicated above: it took 300 years from 1500 to 1800 for the population to double from 500 million to a billion, but only 120 years to double to 2 billion, and only another 45 to double again to 4 billion.
fantastic power and ultimate absurdity of unchecked exponential growth. It also illustrates some of its unsuspecting characteristics: it starts out surprisingly slowly but once unleashed gets completely out of control, gobbling up everything before it. Furthermore, at any one time the size of an exponentially growing population is larger than the sum of all the individuals that existed before
start the process with a single bacterium which, for the sake of argument, we know splits into two identical daughter bacteria every minute. So after one minute we have 2 bacteria, each of which splits into 2 new bacteria after another minute, giving us 4. Another minute later we have 8, then 16, and so on, doubling the number with each successive minute.
at what time between eight a.m. and noon is the container half full?
The correct answer, which comes as a surprise to some, is 11:59, just one minute before noon. I’m sure you’ve got it: since the population doubles every minute, it must have been half of its final size just one minute before the process ends at noon, which is 11:59 a.m.
for almost the entire lifetime of this little universe the container appears empty with almost nothing happening in it, even though the colony is continuing to grow exponentially during the entire time. Only in the last few minutes, corresponding to a tiny fraction of its entire existence and just before this bacterial universe comes to an oblivious end, is there any visible action in the container.
While exponential growth is a remarkable manifestation of our extraordinary accomplishments as a species, built into it are the potential seeds of our demise and the portent of big troubles just around the next corner.
His argument was that the population “multiplies geometrically,” meaning that it increases at an exponential rate, whereas the ability to grow and supply food increases only “arithmetically,” meaning that it increases at a much slower linear rate, so the size of the population will eventually outstrip the food supply, leading to catastrophic collapse. Malthus concluded that in order to avoid such a catastrophe and ensure a sustainable population,
His argument was that the population “multiplies geometrically,” meaning that it increases at an exponential rate, whereas the ability to grow and supply food increases only “arithmetically,” meaning that it increases at a much slower linear rate, so the size of the population will eventually outstrip the food supply, leading to catastrophic collapse. Malthus concluded that in order to avoid such a catastrophe and ensure a sustainable population, some form of population control was needed.
An unfortunate consequence of Malthus’s analyses was that they were interpreted as effectively blaming the poor for their own predicament because they persisted in reproducing too rapidly. It was relatively easy therefore to conclude that it was this rather than exploitation by capitalists that was the origin of their poverty and their generally abysmal condition. As a further consequence of this thinking, traditional Malthusians believed that paternalistic charity for the poor, whether governmental or philanthropic, was counterproductive in that it resulted only in increasing their numbers, therefore contributing further to the exponential growth in the number of dependent poor, the end result being that this would eventually bankrupt the country.
among mainstream economists and social thinkers, Malthusian theory with its implications of imminent catastrophe has become a dirty word.
in complete contradiction to Malthus’s expectations, agricultural productivity did not increase linearly with time but instead tracked population growth and increased exponentially. Furthermore, there has been a steady decrease in human fecundity accompanied by a steady increase in the average standard of living.
The late maverick economist Kenneth Boulding perhaps best summed it up when testifying before the U.S. Congress, declaring that “anyone who believes exponential growth can go on forever in a finite world is either a madman or an economist.”
The original argument of Malthus was wrong because of the unforeseen technological advances in agriculture stimulated by the spirit and discoveries of the Enlightenment and the Industrial Revolution.
tremendous gain in efficiency and the huge decrease in the need for agricultural labor has been a major driver behind the exponential growth in the population of cities.
The spirit and substance of the Second Law of Thermodynamics and its manifestation in terms of entropy production represent the dark side of open-ended exponential growth. Independent of how superbly innovative we are, ultimately everything is driven and processed by the use of energy, and the processing of energy has inevitable deleterious consequences.
Thinking of us as an animal using thirty times more energy than we “should” given our physical size, the effective human population of the planet accordingly operates as if it were much larger than the 7.3 billion people who actually inhabit it. In a very real sense, we are operating as if our population were at least thirty times larger, equivalent to a global population in excess of 200 billion people.
From a scientific perspective the truly revolutionary character of the Industrial Revolution was the dramatic change from an open system where energy is supplied externally by the sun to a closed system where energy is supplied internally by fossil fuel.
This is a fundamental systemic change with huge thermodynamic consequences, because in a closed system the Second Law of Thermodynamics and its requirement that entropy always increases strictly applies. We “progressed” from an external, reliable, and constant source of energy to one that is internal, unreliable, and variable.
the processes that govern the weather and the life history of plants and animals are exponentially sensitive to small changes in the temperature at which they operate. I remind you that a 2°C rise in average temperature leads to a whopping 20 percent increase in these rates.
Social Systems
Remarkably, concepts like energy and entropy, metabolism, and carrying capacity have not found their way into mainstream economics.
There has been no need to think seriously in terms of energy as an underlying driver of economic success or of population growth, let alone to consider entropy as its inevitable consequence.
Nor has there been the need to consider the possibility that resources may actually be limited, nor that there might be underlying physical constraints that would question open-ended growth.
These issues have been conceptually circumvented by invoking the almost magical role that innovation and human ingenuity have played, and presumably will continue to play,
there also seems to be an unexpressed presumption that ideas, the seeds of innovation, cost nothing—after all, they are “just” neural processes in the brains of human beings, and collectively we can produce an almost infinite number of them in our heads. But like everything else, ideas and the innovations they inspire require energy, and lots of it, to support the smart individuals who are thinking and to provide the appropriately stimulating environments and collective experiences we institutionalize in places such as universities, laboratories, parliaments, cafés, concert halls, and conference venues.
The very essence of this is embodied in the concept of the city and of urban life.
Smart and ambitious people are drawn to cities, and this is where our new ideas are incubated, where entrepreneurship flourishes, and where wealth is created. Supporting all of this is extremely expensive, so it is naive to dissociate ideas from energy—one cannot flourish without the other.
All of this requires huge amounts of energy: ex nihilo nihil fit—nothing comes from nothing.
more energy is delivered by the sun in just one hour than is used by the entire world in a single year. Indeed, the scale of solar energy is so vast that in one year it is about twice as much as will ever be obtained from all of the Earth’s nonrenewable resources of coal, oil, natural gas, and uranium combined. So from this point of view, there is no energy problem—at least in principle.
Consequently, the long-term strategy for sustained global energy availability is clear: we need to return to the biological paradigm where most of our energy needs are supplied directly from the sun but in such a way as to maintain and expand what we have so far accomplished. We urgently need to develop the technology that will enable us to harness affordable abundant energy from the sun, primarily from direct radiation but also indirectly from wind, tidal forces, and wave motion.
Shuman was an enthusiast and advocate for solar energy and in 1916 was quoted in The New York Times as saying: We have proved the commercial profit of sun power . . . and have more particularly proved that after our stores of oil and coal are exhausted the human race can receive unlimited power from the rays of the sun.
The lack of progress until relatively recently is quite astonishing given that the basic technology for developing solar energy has been known for more than a hundred years.
In 1897, an American engineer, Frank Shuman, built a proof of principle device for utilizing energy from the sun by showing that it could power a small steam engine. His system was eventually patented in 1912, and in 1913 he constructed the world’s first solar thermal energy power plant, which was built in Egypt. It generated only about 50 kilowatts (about 65 horsepower) but was able to pump more than 5,000 gallons of water a minute (about 22,000 liters a minute) from the Nile onto adjacent cotton fields.
The promise of “unlimited” energy from nuclear power stations producing energy using the same physics that powers the sun is a fantastic idea. When it was first conceived right after the Second World War in the heady days following the development of the atomic bomb, there was tremendous optimism that nuclear energy would soon displace fossil fuels as our primary source of energy.
Unfortunately, using nuclear fusion to generate economically competitive energy has proven to be quite elusive and technologically extremely challenging despite vigorous international efforts to make it viable. Instead, nuclear power has been successfully developed using nuclear fission in which energy is released when heavy nuclei (of uranium) dissociate into lighter products, a process analogous to conventional chemical production of energy from fossil fuels. At present about 10 percent of the world’s electricity is generated using fission, with France leading the way with over 80 percent of its electricity coming from nuclear reactors.
Although nuclear power, like solar, is not a significant source of greenhouse gases and therefore not a driver of possible climate change, its by-products can be extremely deleterious because their energy scale is so much higher (by a factor of a million). Consequently, radiation resulting from nuclear processes can be extremely damaging to molecules and therefore to organic tissue, leading to serious health issues of which cancer is the best known. To a large extent, our atmosphere protects us from similar radiation from the sun, but in reactors on Earth this is a major challenge.
Despite huge efforts to ensure the safety of nuclear reactors, there have now been enough accidents to have dampened the enthusiasm for their utilization as an alternative energy source to fossil fuels, even though the number of direct fatalities has been extremely small. The reverberations from the disaster at the Fukushima nuclear power plant in Japan in 2011 have led to a dramatic decrease in the present and projected future reliance on nuclear energy worldwide.
Even when integrated over the entire lifetime of all nuclear power plants this is less than one hundred people, and most of them died in the Chernobyl disaster in the USSR in 1986, while none died at Fukushima. On the other hand, many thousands may have contracted cancer and died, or will die prematurely, because of radiation exposure from such accidents, particularly from Chernobyl. But this should be “balanced” by the estimated 50 million people who are injured, maimed, or disabled each year by car accidents. And
whether this framework could be extended to understand other networked systems such as cities and companies. Superficially these have much in common with organisms and ecosystems. After all, they metabolize energy and resources, produce waste, process information, grow, adapt and evolve, contract disease, and even develop what could be characterized as tumors and growths. In addition, they age, and in the case of companies, almost all of them eventually die, whereas for cities only extremely few ever do, an enigma we shall come to consider later.
Its motivation was originally expressed as follows: “Because of the obvious analogy with social network systems, such as corporate and urban structures, it is both natural and compelling to investigate the possibility of extending the same sort of analyses used for understanding biological network systems to social organizations,” with an added emphasis that “the flow of information in social organizations is as significant as the flow of matter, energy and resources.”
It is hard not to perceive Masdar as effectively a large private suburban residential industrial park rather than a vibrant diverse autonomous city. In many ways its philosophy is derivative of Ebenezer Howard’s garden city concept brought into the high-tech culture of the twenty-first century, except that it appears to be designed for the privileged rather than for the working poor.
The tension between form and function, between town and country, between organic evolutionary development and the parsimony of unadorned steel and concrete, and between the complexity of fractal-like curves and surfaces and the simplicity of Euclidean geometry, remains an ongoing debate with no simple resolution or any easy answer.
This was the height of the period of “urban renewal” and “slum clearance” in which massive, unattractive high-rise public housing projects were erected along with major four-lane highways running through downtown city areas with little regard for the urban fabric or the human scale. The man behind all of this in New York City was Robert Moses, the powerful mastermind who reshaped and rejuvenated the infrastructure of the city over a period of almost forty years.
Although he accomplished many important things for New York, including the construction of bridges and expressways connecting Manhattan to the other boroughs, he did it at the expense of destroying many traditional neighborhoods.
A major point throughout her writing is that macroeconomically, cities are the prime drivers of economic development, not the nation-state as is typically presumed by most classical economists.
One important insight that resulted from these observations was that most urban development and renewal—and in particular almost all newly created planned cities such as Washington, D.C., Canberra, Brasilia, and Islamabad—has not been very successful. This seems to be the consensus among critics, experts, commentators, and the like.
It may not come as such a big surprise to learn that larger cities require fewer gas stations per capita than smaller ones, but what is surprising is that this economy of scale is so systematic: it is approximately the same across all of these countries, obeying the same mathematical scaling law with a similar exponent of around 0.85.
What is even more surprising is that other infrastructural quantities associated with transport and supply networks, such as the total length of electrical lines, roads, water and gas lines, all scale in much the same way with approximately the same value of the exponent, namely about 0.85. Furthermore, this systematic behavior appears to be the same across the globe wherever data could be obtained. So as far as their overall infrastructure is concerned, cities behave just like organisms—they scale sublinearly following simple power-law behavior, thereby exhibiting a systematic economy of scale, albeit to a lesser degree as represented by the different values of their exponents (0.75 for organisms vs. 0.85 for cities).
city of 10 million people typically needs 15 percent less of the same infrastructure compared with two cities of 5 million each, leading to significant savings in materials and energy use.
New York is the greenest city in the United States, whereas Santa Fe, where I live, is one of the more profligate ones. On average, each of us in Santa Fe is putting almost twice as much carbon into the atmosphere as New York. This should not be thought of as somehow reflecting the greater wisdom of New York’s planners and politicians, nor as the fault of Santa Fe’s leadership, but rather as an almost inevitable by-product of the dynamics underlying economies of scale that transcend the individuality of cities as their size increases.
socioeconomic quantities with no analog in biology such as average wages, the number of professional people, the number of patents produced, the amount of crime, the number of restaurants, and the gross urban domestic product (GDP) also scale in a surprisingly regular and systematic fashion,
as illustrated in Figures 34–38. Also clearly manifested in these graphs is the equally surprising result that all of the slopes of these various quantities have approximately the same value, clustering around 1.15.
in marked contrast to infrastructure, which scales sublinearly with population size, socioeconomic quantities—the very essence of a city—scale superlinearly, thereby manifesting systematic increasing returns to scale. The larger the city, the higher the wages, the greater the GDP, the more crime, the more cases of AIDS and flu, the more restaurants, the more patents produced, and so on, all following the “15 percent rule” on a per capita basis in urban systems across the globe.
observed scaling laws are between cities within the same national urban system, meaning within the same country. Scaling laws such as those shown in Figures 34–38 don’t predict how cities scale between different urban systems.
For example, the overall scale of crime is much lower in Japan than in the United States, whereas the overall production of patents is higher in the United States. Thus while scaling laws predict how Chicago’s metrics scale relative to Los Angeles’s and how Kyoto’s scale relative to Osaka’s, they don’t directly predict how Osaka scales relative to Chicago. However, if we know the overall scale of the metrics—which can be deduced from just knowing, for example, how New York’s metrics scale relative to Tokyo’s, we can then predict how any Japanese city scales relative to any American one.
it’s worth noting that not all characteristics of cities scale nonlinearly. For example, each person on average has a single home and a single job regardless of city size, so that the number of jobs and number of houses increase linearly with city size. In other words, the exponents of their corresponding scaling curves are very close to 1,
designing it, or policing it. It just happened. So what is the common unifying factor that transcends these differences and underlies this surprising structural and dynamical similarity?
Cities are people, and to a large extent people are pretty much the same all over the world in how they interact with one another and how they cluster to form groups and communities.
generic geometric and dynamical properties of biological networks that underlie quarter-power allometric scaling are: (1) they are space filling (so every cell of an organism, for instance, must be serviced by the network); (2) the terminal units, such as capillaries or cells, are invariant within a given design (so, for instance, our cells and capillaries are approximately the same as those of mice and whales); and (3) the networks have evolved to be approximately optimal (so, for instance, the energy our hearts have to use to circulate blood and support our cells is minimized in order to maximize the energy available for reproduction and the rearing of offspring).
These properties have direct analogs in the infrastructural networks of cities. For example, our road and transport networks have to be space filling so that every local region of the city is serviced, just as all of the various utility lines have to supply water, gas, and electricity to all of its houses and buildings.
It’s also natural to extend this concept to social networks: averaged over time, each person interacts with a number of other people as well as with groups of people in the city in such a way that collectively their network of interactions fills the available “socioeconomic space.” Indeed, this urban network of socioeconomic interactions constitutes the cauldron of social activity and interconnectivity that effectively defines what a city is and what its boundaries are. To be part of a city you have to be an ongoing participant in this network. And, of course, the invariant terminal units of these networks, the analogs of capillaries, cells, leaves, and petioles, are people and their houses.
In contrast to the scaling exponent (the 0.85), which is the slope of the straight lines in the logarithmic plots and which is approximately the same for all urban systems, the degree of variation (that is, the spread) of the data around these straight lines (all having similar slopes) is different in different urban systems. This is largely because different nations have devoted different amounts of resources to maintenance, improvements, and innovations of their cities.
what, if anything, is being optimized in urban social networks.
If we think of the city as the great facilitator of social interactions or as the great incubator for wealth creation and innovation, it is natural to speculate that its structure and dynamics evolved so as to maximize social capital by optimizing the connectivity between individuals.
Greed is the pejorative image of this insatiable desire for more, but it also has an extremely important, positive flip side. Metaphorically, it is the social analog of the evolutionary biological drive of animals, including us, to maximize their metabolic power relative to their size.
In addition to providing a metric for comparing the complexity of different cities, perhaps one of the more interesting uses of a fractal dimension is as a diagnostic barometer of the health of a city. Typically, the fractal dimension of a healthy robust city steadily increases as it grows and develops, reflecting a greater complexity as more and more infrastructure is built to accommodate an expanding population engaging in more and more diverse and intricate activities.
fractal dimensions are a measure of an object’s degree of crinkliness, which some interpret as a measure of its complexity.
a city’s fractal nature may not always be so obvious from just looking at its physical manifestation. After all, the street plan of New York City or for that matter almost any American city is typically a regular rectangular grid, which is about as simplistically Euclidean as you can get.
not as true in Old World cities like London or Rome, whose meandering streets have a more obvious fractal-like organic structure. In either case, hidden beneath the geometry even of cities with rectangular grids lurks a fractality that permeates all cities and is reflected in the universality of the scaling laws.
In addition to the actual flows in these networks, the major geometric difference between them is the value of the branching ratio—the number of units, people in this case, at one level of the hierarchy relative to the next. There is evidence that in social networks this pattern with a branching ratio of three persists beyond the 150 level to groups having sizes of approximately 500, 1,500, and so on.
The important point for our purposes is that viewed through a coarse-grained lens, social networks exhibit an approximate fractal-like pattern and that this seems to hold true across a broad spectrum of different social organizations.
The number of around 150 represents the maximum number of individuals that a typical person can still keep track of and consider casual friends and therefore members of his or her ongoing social network. Consequently, this is the approximate size of a group in which all individuals still know one another sufficiently well for the group to remain coherent and maintain ongoing social relationships.
It’s an intriguing observation: in its simplest
in its simplest form, it states that the rank order of a city is inversely proportional to its population size. Thus, the largest city in an urban system should be about twice the size of the second largest, three times the size of the third largest, four times the size of the fourth largest, and so on. So, for example, in the 2010 census, the biggest city in the United States was
same law is valid across an astonishing array of examples, including the rank size distributions of ships, trees, sand particles, meteorites, oil fields, file sizes of Internet traffic, and many more.
In economics, Zipf’s law actually predates Zipf. Much earlier it had been discovered by the influential Italian economist Vilfredo Pareto, who expressed it as a frequency distribution of incomes in a population rather than in terms of their ranking.
Despite their generality, there are often large deviations from Zipf’s and Pareto’s “laws”
The canonical Gaussian bell curve is so pervasive and so taken for granted that it is generally assumed without much thought that that’s how “everything” is distributed. Consequently, power law distributions like those of Zipf and Pareto barely saw the light of day.
social connectivity and therefore socioeconomic quantities scale superlinearly with population size. Socioeconomic quantities are the sum of the interactions or links between people and therefore depend on how correlated they are. In the extreme case when everyone is interacting with everyone else we saw that this leads to a superlinear power law whose exponent is 2. However, in reality there are significant constraints on the intensity and magnitude of how many people an individual can interact with, and this drastically reduces the value of the exponent to be less than 2.
Mobility and social interaction, both so essential for the successful operation of a city, bring together the constraints of space and time—you cannot remain static and you do have to be somewhere—which interweave the structure, organization, and dynamics of social and infrastructural networks.
The integration of these two kinds of networks, namely, the requirement that socioeconomic interaction represented by space-filling fractal-like social networks must be anchored to the physicality of a city as represented by space-filling fractal-like infrastructural networks, determines the number of interactions an average urban dweller can sustain in a city.
Combining the ideas of space filling, invariant terminal units, and optimization (minimizing travel times and energy use, for example) results in these networks also being fractal-like with infrastructural metrics scaling as power laws with sublinear exponents indicative of economies of scale obeying the 15 percent rule.
the number of interactions with other people in a city that an average person maintains scales inversely to the way that the degree of infrastructure scales with city size.
the degree to which the scaling of infrastructure and energy use is sublinear is predicted to be the same as the degree to which the scaling of the number of an average individual’s social interactions is superlinear.
Using data from cities across several countries, including the United States, England, Germany, and some developing nations, Zahavi discovered the surprising result that the total amount of time an average individual spends on travel each day is approximately the same regardless of the city size or the mode of transportation.
we tend to spend about an hour each day traveling, whoever and wherever we are. Roughly speaking, the average commute time from home to work is about half an hour each way independent of the city or means of transportation.
even though some people travel faster, some by car or train, some by bus or subway, and some much slower by bicycling or walking, on average all of us spend up to an hour or so traveling to and from work. So the increase in transportation speed resulting from the marvelous innovations of the past couple of hundred years has not been used to reduce commuting time but instead has been used to increase commuting distances.
He became intrigued by Zahavi’s work and in 1994 published an extensive paper elaborating on the approximate invariance of daily commute times and promoted the idea that the true invariant is actually overall daily travel time, which he called exposure time.3 So even if an individual’s daily commute time is less than an hour, then he or she instinctively makes up for it by other activities such as a daily constitutional walk or jog. In support of this Marchetti wryly remarked, “Even people in prison for a life sentence, having nothing to do and nowhere to go, walk around for one hour a day, in the open.”
Amusingly, data confirm that walking speeds do indeed increase with city size following an approximate power law, though its exponent is somewhat less than the canonical 0.15, being closer to 0.10
The size of an average individual’s modular cluster of acquaintances who interact with one another is an approximate invariant—it
doesn’t change with city size.
number of visitors should scale inversely as the square of both the distance traveled and the frequency of visitation.
the prediction of movement in cities can be restated as saying that the number of people traveling to a specific location scales with both the distance traveled and the visitation frequency as a power law whose exponent is −2.
if the number of travelers is plotted logarithmically against either the distance traveled keeping the visitation frequency fixed, or vice versa, against the visitation frequency keeping the travel distance fixed, a straight line should result in both cases with the same slope of -2 (recall that the minus sign simply means that the line slopes downward). I should emphasize that as with all of the scaling laws, an average over a long enough period of time, such as six months or a year, is presumed, in order to smooth over daily fluctuations, or the differences between weekdays and weekends.
the same predicted inverse square law is observed across the globe in diverse cities with very different cultures, geographies, and degrees of development: we see an identical behavior in North America (Boston), Asia (Singapore), Europe (Lisbon), and Africa (Doha).
Suppose that on average 1,600 people visit the area around Park Street, Boston, from 4 kilometers away once a month. How many people visit there from twice as far away (8 km) with the same frequency of once a month? The inverse square law tells us that ¼ (= ½2) as many make the visit, so only 400 people (¼ × 1,600) visit Park Street from 8 kilometers away once a month.
you can likewise ask what happens if you change the frequency of visitation. For instance, suppose we ask how many people visit Park Street from 4 kilometers away but now with a greater frequency of twice a month. This also obeys the inverse square law so the number is ¼ (= ½2) as many, namely 400 people.
if the distance traveled multiplied by the frequency of visits to any specific location is kept the same, then the number of people visiting also remains the same.
In situations like this where we are able to develop a quantitative scientific framework for performance based on scaling, we can also construct meaningful metrics for rankings and for comparison across different competitions. More mechanical sports such as weight lifting, rowing, and even running potentially lend themselves to this methodology, whereas team sports like football and basketball are considerably more challenging.
Deviations from scaling therefore provide a principled metric for individual performance and a quantitative point of departure for investigating why, as in the weight lifting case, the middleweight overperformed and the heavyweight underperformed relative to their size.
In Singapore there is only one such major outlier, namely, Raffles Place, which is the central core of the city-state’s financial district. In addition, it is a major transportation hub and a gateway to a large tourist area. The data on the number of visitors actually scale reasonably well, but the exponent is significantly smaller than in the rest of Singapore’s locations, all of which are in excellent agreement with the predicted value of −2.
As in the case of Boston’s airport and stadium, it’s important for planning, designing, and controlling transport and movement for both this specific special location as well as across the entire city to recognize that Raffles Place is an outlier from the dominant mobility pattern observed in every other location in the city. Equally important is that this can be quantified and understood within the context of the entire urban system.
The ubiquitous use of per capita indicators for ranking and comparing cities is particularly egregious because it implicitly assumes that the baseline, or null hypothesis, for any urban characteristic is that it scales linearly with population size.
In assessing the performance of a particular city, we therefore need to determine how well it performs relative to what it has accomplished just because of its population size.
Once a city has gained an advantage, or disadvantage, relative to its scaling expectation, this tends to be preserved over decades. In this sense, either for good or for bad, cities are remarkably robust and resilient—they are hard to change and almost impossible to kill.
New York City is rightly famous for being a trendsetter in almost everything, but one of its achievements that is not often appreciated is its water system. Its quality and taste are often considered to be superior not just to water from other municipalities, but to fancy bottled water and at a fraction of the cost without
Water is supplied to the city from watersheds that are up to one hundred miles north of the city and primarily fed by gravity flow, thereby saving huge energy costs in pumping.
water leaves the reservoirs through massive “pipes” that are actually deep underground concrete tunnels. A new $5 billion project is presently under way to build a new tunnel to augment two older ones. It will eventually span sixty miles in length at a depth of up to eight hundred feet, and its diameter when leaving the reservoir is twenty-four feet
This steps down in progressive sections as water is distributed through the network hierarchy to the entire New York metropolitan area, eventually feeding the main pipes buried beneath streets whose diameters are anywhere from four to twelve inches depending on the building density
Water is distributed from these mains to individual homes through one-inch pipes that are then further downsized to half an inch before they reach kitchen sinks and toilets.
This template is quite similar to our own circulatory system, even to the extent that both networks are space filling and the terminal units in both systems are approximately invariant.
the total number of establishments in each city regardless of what business they conduct turns out to be linearly proportional to its population size. Double the size of a city and on average you’ll find twice as many businesses.
The proportionality constant is 21.6, meaning that there is approximately one establishment for about every 22 people in a city, regardless of the city size. Or to put it slightly differently, on average a new workplace is created each time the population of a city increases by just 22 people, whether in a small town or a large metropolis.
Similarly, the data also show that the total number of employees working in these establishments also scales approximately linearly with population size: on average, there are only about 8 employees for every establishment, again regardless of the size of the city.
diversity systematically increases with population size at all levels of resolution, as defined by the NAICS data set. Unfortunately, the classification scheme is unable to capture the full extent of economic diversity in the largest cities because it is unable to differentiate among very closely related types of establishments such as, for instance, between a northern and southern Italian restaurant.
if we could measure diversity to the finest possible resolution it would scale logarithmically with city size.
doubling the size of a city results in doubling the total number of establishments, but only a meager 5 percent increase in new kinds of businesses.
Almost all of this increase in diversity is reflected in a greater degree of specialization and interdependence involving larger numbers of people, both as workers and as clients. This is an important observation because it shows that increasing diversity is closely linked to increasing specialization, and this acts as a major driver of higher productivity following the 15 percent rule.
A more detailed way of assessing economic diversity is to dig deeper and examine the specific component types of establishments that constitute the business landscape of individual cities. How many lawyers, doctors, restaurants, or contractors are there in each city, and how many of these are corporate lawyers, orthopedic surgeons, Indonesian restaurants, or plumbing contractors?
When one considers the vast range of income, density, and population levels, let alone the uniqueness and diverse cultures that vary so widely in cities across the United States, this universality is quite surprising. What is particularly satisfying is that this unexpected universality, as well as the actual form of the universal curve and the logarithmic scaling of diversity, can all be derived from theory.
Initially, small cities with a limited portfolio of economic activities need to create new businesses and functionalities at a fast rate. These basic activities constitute the economic core of every city, big and small; every city needs lawyers, doctors, shopkeepers, tradesmen, administrators, builders, et cetera. As cities grow and these basic core activities become saturated, the pace at which new functionalities are introduced slows down dramatically but never completely ceases. Once the set of individual building blocks is large enough, the resulting combination of talents and functions is sufficient to generate novel variations that expand the business landscape, giving rise to specialized establishments such as exotic restaurants, professional sports teams, and luxury stores, leading to greater economic productivity.
Although the theory cannot predict how specific business types rank in individual cities (why, for instance, doctors are first in New York but seventh in San Jose), it does predict how their rankings change as cities grow. The general rule is that business types whose abundances scale superlinearly with population size systematically rise in their rankings, whereas those that scale sublinearly systematically decrease.
at the coarsest level of the NAICS classification scheme traditional sectors such as agriculture, mining, and utilities scale sublinearly; the theory predicts that the rankings and relative abundances of these industries decrease as cities get larger. On the other hand, informational and service businesses such as professional, scientific, and technical services, and management of companies and enterprises, scale superlinearly and are consequently predicted to increase disproportionally with city size, as observed.
consider the number of lawyers’ offices. This scales superlinearly with an exponent close to the canonical 1.15, meaning that there are systematically more lawyers per capita in larger cities.
The preferential attachment model predicts that as a city grows the ranking of lawyers should increase as an approximate power law with an exponent of about 0.4, as observed.
the scaling exponents that relate how the abundances of each business category scale with city size capture the disproportionate growth of different business sectors and parameterize them in a more systematic way than simple counts of businesses, or “expert” judgments on the nature of sectors, which are very often quite subjective.
cities and businesses are complex adaptive systems and should consequently be viewed as an integrated system and not as isolated individual agents. By looking at all cities and the complete set of business sectors that constitute the entire urban economy in a country, this analysis couples the economic fabric of each city with that of the entire system of cities.
Roughly speaking, incoming metabolized energy and resources are apportioned between general maintenance and repair, including replacement of what’s already there and has decayed and the creation of new entities, whether cells, people, or infrastructure, that add to the system and increase its size. Thus the energy available for growth is just the difference between the rate at which energy can be supplied and the rate that is needed for maintenance.
metabolic rate in organisms scales sublinearly with the number of cells (following the generic ¾ power exponent derived from network constraints) while the demand increases approximately linearly. So as the organism increases in size, demand eventually outstrips supply because linear scaling grows faster than sublinear, with the consequence that the amount of energy available for growth continuously decreases, eventually going to zero resulting in the cessation of growth.
growth stops because of the mismatch between the way maintenance and supply scale as size increases. The sublinear scaling of metabolic rate and the associated economies of scale arising from optimizing network performance are therefore responsible for why growth stops and why biological systems exhibit the bounded sigmoidal growth curves
The same network mechanism that underlies sublinear scaling, economies of scale, and the cessation of growth is also responsible for the systematic slowing down of the pace of biological life as size increases—and for eventual death.
cities are comprised of two generic components: their physical infrastructure, manifested as buildings, roads, et cetera, and their socioeconomic dynamics, manifested as ideas, innovation, wealth creation, and social capital. Both are networked systems, and their tight interconnectivity and interdependence result in the approximate complementarity between the corresponding sub- and superlinear scaling laws, namely, that the 15 percent savings with every doubling of size in the former are approximately equal to the 15 percent gain in the latter.
the physical infrastructural component, that has close analogies to biology and provides the metaphor of the city as an organism.
the city is much more than its physicality.
the concept of metabolic rate as the supply-side input that fuels growth and sustains a city has to be expanded to include socioeconomic activity.
In addition to heating buildings, transporting materials and people, manufacturing goods, and providing gas, water, and electricity, every transaction, every dollar gained or lost, every conversation and meeting, every phone call and text message, every idea and every thought has to be fueled by energy.
just as food must be metabolized into a form that is useful for supplying cells and sustaining life, so the incoming energy and resources digested by a city must be transformed into a form that can be used to supply, sustain, and grow socioeconomic activities such as wealth creation, innovation, and the quality of life.
all socioeconomic contributions to social metabolism that underlie growth, including wealth creation and innovation, scale in approximately the same way following the classic superlinear power law with a common exponent of approximately 1.15.
The superlinear scaling of metabolism has profound consequences for growth. In contrast to the situation in biology, the supply of metabolic energy generated by cities as they grow increases faster than the needs and demands for its maintenance.
Consequently, the amount available for growth, which is just the difference between its social metabolic rate and the requirements for maintenance, continues to increase as the city gets larger. The bigger the city gets, the faster it grows—a classic signal of open-ended exponential growth.
Companies
sublinear scaling and economies of scale that dominate biology lead to stable bounded growth and the slowing down of the pace of life, whereas superlinear scaling and increasing returns to scale that dominate socioeconomic activity lead to unbounded
sublinear scaling and economies of scale that dominate biology lead to stable bounded growth and the slowing down of the pace of life, whereas superlinear scaling and increasing returns to scale that dominate socioeconomic activity lead to unbounded growth and to an accelerating pace of life.
there are very few extremely large companies, but an enormous number of very small ones, with all of those in between following a simple systematic power law distribution.
In the language of the framework developed in previous chapters these can be expressed as follows: (1) Minimizing transaction costs reflects economies of scale driven by an optimization principle, such as maximizing profits. (2) Organizational structure is the network system within a company that conveys information, resources, and capital to support, sustain, and grow the enterprise. (3) Competition results in the evolutionary pressures and selection processes inherent in the ecology of the marketplace.
It is sobering that no such detailed model for how the economy actually works exists and that policy is typically determined by relatively localized, sometimes intuitive, ideas of how it should work.
companies do indeed scale following simple power laws and as anticipated they do so with a much greater spread around their average behavior than for either cities or organisms.
in this statistical sense, companies are approximately scaled, self-similar versions of one another: Walmart is an approximately scaled-up version of a much smaller, modest-size company. Even after taking this greater variance into account, this scaling result reveals remarkable regularities in the size and dynamics of companies and is quite surprising given the tremendous variety of different business sectors, locations, and age.
Income, profit, assets, and sales for all 28,853 publicly traded companies in the United States from 1950 to 2009 plotted logarithmically against their number of employees showing sublinear scaling with a substantial variance.
Although binning is not a rigorous mathematical procedure, the stability of obtaining approximately the same straight-line fit using different resolutions lends strong support to the hypothesis that on average companies are self-similar and satisfy power law scaling.
Chinese companies scaled in a similar fashion to U.S. companies,
in a vigorous fast-track setting, competitive “free” market dynamics are sufficiently potent for systematic trends to begin to emerge relatively quickly.
A crucial aspect of the scaling of companies is that many of their key metrics scale sublinearly like organisms rather than superlinearly like cities. This suggests that companies are more like organisms than cities and are dominated by a version of economies of scale rather than by increasing returns and innovation.
sublinear scaling therefore suggests that companies also eventually stop growing and ultimately die,
nonlinear scaling of maintenance expenses in younger companies, buoyed by investments and the ability to borrow large amounts relative to their size, fuels their rapid growth. Consequently, the idealized growth curve of companies has characteristics in common with classic sigmoidal growth in biology in that it starts out relatively rapidly but slows down as companies become larger and maintenance expenses transition to becoming linear.
where the overall growth of the market has been factored out, all large mature companies have stopped growing. Their growth curves when corrected for both inflation and the expansion of the market now look just like typical sigmoidal growth curves of organisms in which growth ceases at maturity,
notice the rapid “hockey stick” rise of small, younger companies versus the relative slow growth of larger, mature ones.
We, too, are finely balanced between metabolism and maintenance costs, a condition biologists refer to as homeostasis. The gradual buildup of unrepaired damage resulting from the wear and tear inherent in the process of living makes us less resilient and increasingly vulnerable to fluctuations and perturbations as we age.
The survival analyses tell us that there should be very few very old companies. An extrapolation of the theory and data predicts that the probability of a company’s lasting for one hundred years is only about forty-five in a million, and for it to last two hundred years it’s a minuscule one in a billion.
According to the Bank of Korea, of the 5,586 companies that were more than two hundred years old in 2008, over half (3,146 to be precise) were Japanese, 837 German, 222 Dutch, and 196 French.
Furthermore, 90 percent of those that were more than one hundred years old had fewer than three hundred employees.
despite an extensive literature on the subject, we know much less about the network structures of companies other than that they are for the most part hierarchical.
we don’t typically know how many people are functioning at each level, how much of the company’s finances and resources are flowing between them, and how much information they are exchanging. And even if some of this were available, we need to have it across the entire size range of companies. Furthermore, it is not at all clear that the “official” organizational charts of companies represents the actuality of what the real operational network structures are. Who is really communicating with whom, how often are they doing it, how much do they exchange, and so on? What is really needed is access to all of the company’s communication channels, such as the phone calls, the e-mails, the meetings, et cetera, quantified analogously to the cell phone data we used for helping to develop a science of cities. It’s unlikely such comprehensive data exist and even less likely that we would ever gain ready access to them.
In biology, the network principles underlying economies of scale and sublinear scaling have two profound consequences. They constrain the pace of life—big animals live longer, evolve more slowly, and have slower heart rates, all to the same degree—and limit growth. In contrast, cities and economies are driven by social interactions whose feedback mechanisms lead to the opposite behavior.
The theory dictates that to sustain continuous growth the time between successive innovations has to get shorter and shorter. Thus paradigm-shifting discoveries, adaptations, and innovations must occur at an increasingly accelerated pace.