Expectations Investing (Mauboussin)
Books · Source
Overview
A DCF-based approach that works for the modern world
Instead of being constrained by a “value” or “growth” investing style, simply pursue maximal long-term returns within a specified investment policy
Instead of forecasting cash flows, expectations investing starts with the current stock price and uses the discounted cash flow model to “read” what the market implies about a company’s future performance. This involves two things – valuing business-as-usual cash flow using a DCF model, and valuing the contingent nature of an option associated with a given asset
The option is highly valuable when there is a high level of volatility in outcomes (high σ), when the net present value of future cashflows increases (S - X), or we extend the time we can defer decisions (T). And when management can create, identify, evaluate, and nimbly exploit opportunities in a dynamic environment
Digital is (slightly) different
Companies based on knowledge assets have characteristics that are distinct from companies based on physical assets. As a result, you must evaluate them somewhat differently. these characteristics include:
- Up-front costs, low incremental costs ⇒ can lead to massively efficient scale players when the industry allows for it (aggregators)
- Aggregators own the relationship with the user, there is zero (or very low) marginal cost to serve new users, and the cost to acquire users goes down as the result of positive feedback). Aggregators enjoy economies of scale that create a formidable barrier to entry
- Network effects can be much more prevalent, leading to dominant platforms
- Platforms become integral to ecosystems such that they create substantial switching costs for users.
- Lock-in can be far more pronounced. Once customers develop user skills with a given product, or set corporate standards for a product, they often hesitate to switch to a competing offering, even if a rival product performs better or has a lower price
As such, “customer-based corporate valuation,” or CBCV, can sometimes work better when valuing digital companies. This approach values a company from the bottom up by analyzing the economics of customer relationships.
- CBCV’s main contribution is the ability to accurately forecast sales growth. This is extremely useful as sales growth is commonly the most important value driver.
- How fast new customers are added, a customer retention model to understand how long they will remain active buyers, a purchase model to understand how often they will buy, and a model to understand how much they will purchase when they do transact.
The Expectations Investing Process
Step 1: Estimate Price-Implied Expectations
- The expectations investing approach harnesses the powerful discounted cash flow model but starts with price and then solves for cash flow expectations
- Traditional Discounted Cash Flow analysis requires you to forecast cash flows to estimate a stock’s value. Expectations investing reverses the process.
Step 2: Identify Expectations Opportunities
- Stock prices relate tenuously to earnings growth. Instead, changes in expectations about future cash flows drive changes in shareholder value and stock price.
- The degree to which changes in sales growth expectations matter depends on whether a company is creating shareholder value. Sales growth adds value when a company generates returns on its growth investments that exceed its cost of capital. If returns fall below the cost of capital, then growth destroys value.
Step 3: Buy, Sell, or Hold?
- Rather than struggle to forecast long-term cash flows or employ unreliable, short-term valuation proxies, expectations investors establish the future cash flow performance implied by stock prices as a benchmark for deciding whether to buy, hold, or sell.
- changes in operating value drivers are really the culminating effect, not the fundamental cause, of expectations revisions. It turns out that the right place for expectations revisions is with the fundamental building blocks of shareholder value: sales, operating costs, and investments
| Operating value driver | Value factor | Key issues |
|---|---|---|
| Sales growth rate | Volume | - industry growth |
- market share
- customer retention (churn) | | Sales growth rate | Price and mix | - price changes
- mix changes | | Operating profit margin | Price and mix | - price changes
- mix changes | | Operating profit margin | Operating leverage | - preproduction costs
- position in investment cycle
- divisibility of investment | | Operating profit margin | Economies of scale | - purchasing
- production
- distribution
- learning curve | | Operating profit margin | Cost efficiencies | - process configuration
- technology
- outsourcing | | Incremental investment rate | Investment efficiencies | - technology
- facilities reconfiguration |
Evaluating company and industry attractiveness
- Industry attractiveness combines the market characteristics with an assessment of industry structure.
- Market characteristics include growth in the market, supply and demand fundamentals for both customers and suppliers, rate of innovation, and regulatory shifts. Industry structure involves market share, entry and exit barriers, vertical-integration potential, threat of substitute products, modes of competition, and industry profitability.
- the company’s performance and competitive position are driven by its chosen strategies in areas such as product quality, technology, vertical integration, cost position, service, pricing, brand identification, and distribution channel focus
- A good starting point is to create an industry map.
- The boundaries of an industry are not always clear, but seeing where a company fits into a bigger picture helps draw out critical questions.
- Creating a map also provides a good opportunity to think about the potential for new entrants. Consider which companies are not on the map now but are logical competitors in the future.
- A value pool analysis allows you to see an industry’s value creation. The horizontal axis is a measure of size, such as sales or assets. The vertical axis reflects the spread between the operating profit margin and the threshold margin.
- How Companies Add Value: Value created = Willingness to pay − Opportunity cost
- two main ways a company can create value. The first is to be able to increase the willingness to pay of customers while remaining competitive on costs (Differentiation)
- The second is the ability to produce a good or service at a lower relative cost while being able to charge a sufficient price. This is a low-cost strategy.
- Magretta suggests some ways to use the value chain to pinpoint a company’s potential sources of competitive advantage:
- Compare the company to the industry.
- Identify the drivers of price or sources of differentiation.
- Identify the drivers of cost.
Highlights (for my reference only – not relevant to most people)
Stock prices are a treasure of information about the market’s expectations of a company’s future performance.
Although investors do talk about expectations, they’re usually talking about the wrong expectations. The mistakes in assessing expectatons fall into two camps. Investors either don’t appreciate the structure of market expectations or they do a poor job of benchmarking expectations.
expectations investing starts by reading the expectations implied by a company’s stock price.
The process also incorporates the concepts of value creation and competitive strategy analysis.
four primary reasons that institutional investors underperform passive benchmarks: tools, costs, incentives, and style limitations.
Hi Tools Standard practice: Most investors use accounting-based tools such as short-term earnings and price-earnings multiples. These measures are inherently flawed and are becoming even less useful as companies increasingly depend on intangible rather than tangible assets to create value.
Costs
surest route to top-quartile returns is bottom-quartile expenses.
asset-weighted expense ratio for actively managed U.S. equity mutual funds averages about 0.68 percent of asset value. In contrast, the equivalent expense ratio for passive funds is 0.09 percent of asset value.
Incentives
inability to sustain pain in the short term can affect the opportunity to achieve superior gains in the long term. Many managers naturally obsess over short-term relative returns.
The result has been a shift from identifying mispriced stocks to minimizing the variance from the benchmark.
Style Limitations
Most professional money managers classify their investing style as either growth or value. Expectations investing doesn’t distinguish between growth and value. Portfolio managers simply pursue maximum long-term returns within a specified investment policy.
The Expectations Investing Process: Step 1: Estimate Price-Implied Expectations, Step 2: Identify Expectations Opportunities
Once we estimate current expectations, we apply the appropriate strategic and financial tools to determine where and when revisions in expectations are likely to occur.
Step 3: Buy, Sell, or Hold?
Prospective buys must offer a clear-cut “margin of safety,” a sufficient discount to expected value so as to compensate for the potential of analytical mistakes or bad luck.
But three pervasive misconceptions in the investment community deserve special mention: 1. The market takes a short-term view. 2. Earnings per share (EPS) dictate value. 3. Price-earnings multiples determine value.
Belief: The Market Takes a Short-Term View Reality: The Market Takes a Long-Term View
Belief: Earnings per Share (EPS) Dictate Value Reality: Earnings Tell Us Little About Value
Belief: Price-Earnings Multiples Determine Value Reality: Price-Earnings Multiples Are a Function of Value
Essential Ideas • Investors who can read the market’s expectations and anticipate changes in those expectations will more likely generate superior investment returns. • The expectations investing approach harnesses the powerful discounted cash flow model but starts with price and then solves for cash flow expectations. • Investors who play the earnings expectations game are likely to lose because short-term earnings do not reflect how the market prices stocks.
When new investments yield a return below the cost of capital, shareholder value decreases even as earnings increase.
Stock prices relate tenuously to earnings growth. Instead, changes in expectations about future cash flows drive changes in shareholder value and stock price.
TRADITIONAL DISCOUNTED cash flow analysis requires you to forecast cash flows to estimate a stock’s value. Expectations investing reverses the process.
stocks have uncertain cash flows, an indefinite life, and no provision for repayment. That greater uncertainty makes stocks more difficult to value than bonds.
First, market prices respond to changes in a company’s prospects for cash flow. Second, market prices reflect cash flows well into the future. As noted before, companies often need ten years of value-creating cash flows to justify their stock price. This period can be as long as twenty years for companies with formidable competitive advantages.
Essential Ideas • The magnitude, timing, and riskiness of cash flows determine the market prices of financial assets, including bonds, real estate, and stocks. • You can estimate the shareholder value of a stock by forecasting free cash flows and discounting them back to the present.
- Rather than struggle to forecast long-term cash flows or employ unreliable, short-term valuation proxies, expectations investors establish the future cash flow performance implied by stock prices as a benchmark for deciding whether to buy, hold, or sell.
The Expectations Infrastructure
EXPECTATIONS INVESTING is based on two simple ideas: First, you can read stock prices and estimate the expectations that they imply. Second, you will earn superior returns only if you correctly anticipate revisions in those price-implied expectations.
- Where should we look for expectations revisions? 2. Are all expectations revisions created equally?
changes in operating value drivers are really the culminating effect, not the fundamental cause, of expectations revisions. It turns out that the right place for expectations revisions is with the fundamental building blocks of shareholder value: sales, operating costs, and investments. We call them value triggers because they start the expectations revisions process.
an increase in a company’s expected sales may or may not cause operating profit margins to change. We need one more set of analytical tools to systematically capture the relationship between the value triggers and the value drivers. We call them the value factors.

They include volume, price and mix, operating leverage, economies of scale, cost efficiencies, and investment efficiencies.
The expectations infrastructure is based on established microeconomic principles and guides rigorous analysis of historical and prospective performance. It also sorts out cause and effect, providing investors with a clear means to evaluate all the factors that come into play with a trigger revision. Most Wall Street investors who use sensitivity analysis fail to capture these dynamics.
| Operating value driver | Value factor | Key issues |
|---|---|---|
| Sales growth rate | Volume | - industry growth |
- market share
- customer retention (churn) | | Sales growth rate | Price and mix | - price changes
- mix changes | | Operating profit margin | Price and mix | - price changes
- mix changes | | Operating profit margin | Operating leverage | - preproduction costs
- position in investment cycle
- divisibility of investment | | Operating profit margin | Economies of scale | - purchasing
- production
- distribution
- learning curve | | Operating profit margin | Cost efficiencies | - process configuration
- technology
- outsourcing | | Incremental investment rate | Investment efficiencies | - technology
- facilities reconfiguration |
Value Factor 1: Volume
Value Factor 2: Price and Mix
Goodyear Tire & Rubber is a good example of how sales mix can improve operating profit margins. Goodyear’s sales in 2015 were 28 percent lower than those in 2011, and its total unit volume was down 8 percent. Yet the company’s operating profit rose nearly 50 percent over that period, and its operating profit margin expanded 6 percentage points. The key was a shift in mix from low-margin commodity tires to high-margin premium tires.
Value Factor 3: Operating Leverage
Preproduction outlays dampen operating profit margins. Subsequent sales growth, on the other hand, leads to higher operating profit margins. Investors and managers commonly call this operating leverage.
Value Factor 4: Economies of Scale
Value Factor 5: Cost Efficiencies
Cost efficiencies that are unrelated to scale can also affect operating profit margin. These efficiencies span activities from the acquisition of raw materials to the sale and distribution of goods or services. Companies achieve cost efficiencies in two fundamental ways.6 Either they reduce costs within activities,
or they significantly reconfigure their activities.
Value Factor 6: Investment Efficiencies
Businesses enjoy investment efficiencies when they can invest less for a given level of sales and operating profit.9 For example, McDonald’s continues to grow by opening new stores. In the 1990s, the company figured out a way to minimize new store investment, including the building itself, the land, and the equipment. In 1990, the average cost for a traditional McDonald’s restaurant was $1.6 million. By 1994, McDonald’s had trimmed the cost to $1.1 million by simplifying the building design and using modular buildings, which require smaller land parcels.
The degree to which changes in sales growth expectations matter depends on whether a company is creating shareholder value. Sales growth adds value when a company generates returns on its growth investments that exceed its cost of capital. If returns fall below the cost of capital, then growth destroys value.
The wider the expected spread between operating profit margin and threshold margin and the faster the sales growth rate, the more likely it is that sales growth is the dominant trigger.
Framework for Assessing Competitive Strategy
First is getting the lay of the land by understanding the high-level characteristics of the industry. Next, you can do specific industry analysis. Industry attractiveness combines the market characteristics with an assessment of industry structure.
Market characteristics include growth in the market, supply and demand fundamentals for both customers and suppliers, rate of innovation, and regulatory shifts. Industry structure involves market share, entry and exit barriers, vertical-integration potential, threat of substitute products, modes of competition, and industry profitability.
The final level of analysis seeks to identify firm-specific sources of advantage. An individual company generally has minimal influence over industry attractiveness. In contrast, the company’s performance and competitive position are driven by its chosen strategies in areas such as product quality, technology, vertical integration, cost position, service, pricing, brand identification, and distribution channel focus.
Understanding the Industry Landscape
The goal of this level is to understand how the industry works and what some of its key traits are, including profitability, stability, and exposure to external forces. A good starting point is to create an industry map.
Start by putting the company you are analyzing in the middle of the map. It is common to have suppliers on the left and customers on the right. Try to include all companies that might have an impact on the profitability of the business. It is also helpful to list firms in order of size to get a sense of their relative positions. The boundaries of an industry are not always clear, but seeing where a company fits into a bigger picture helps draw out critical questions.
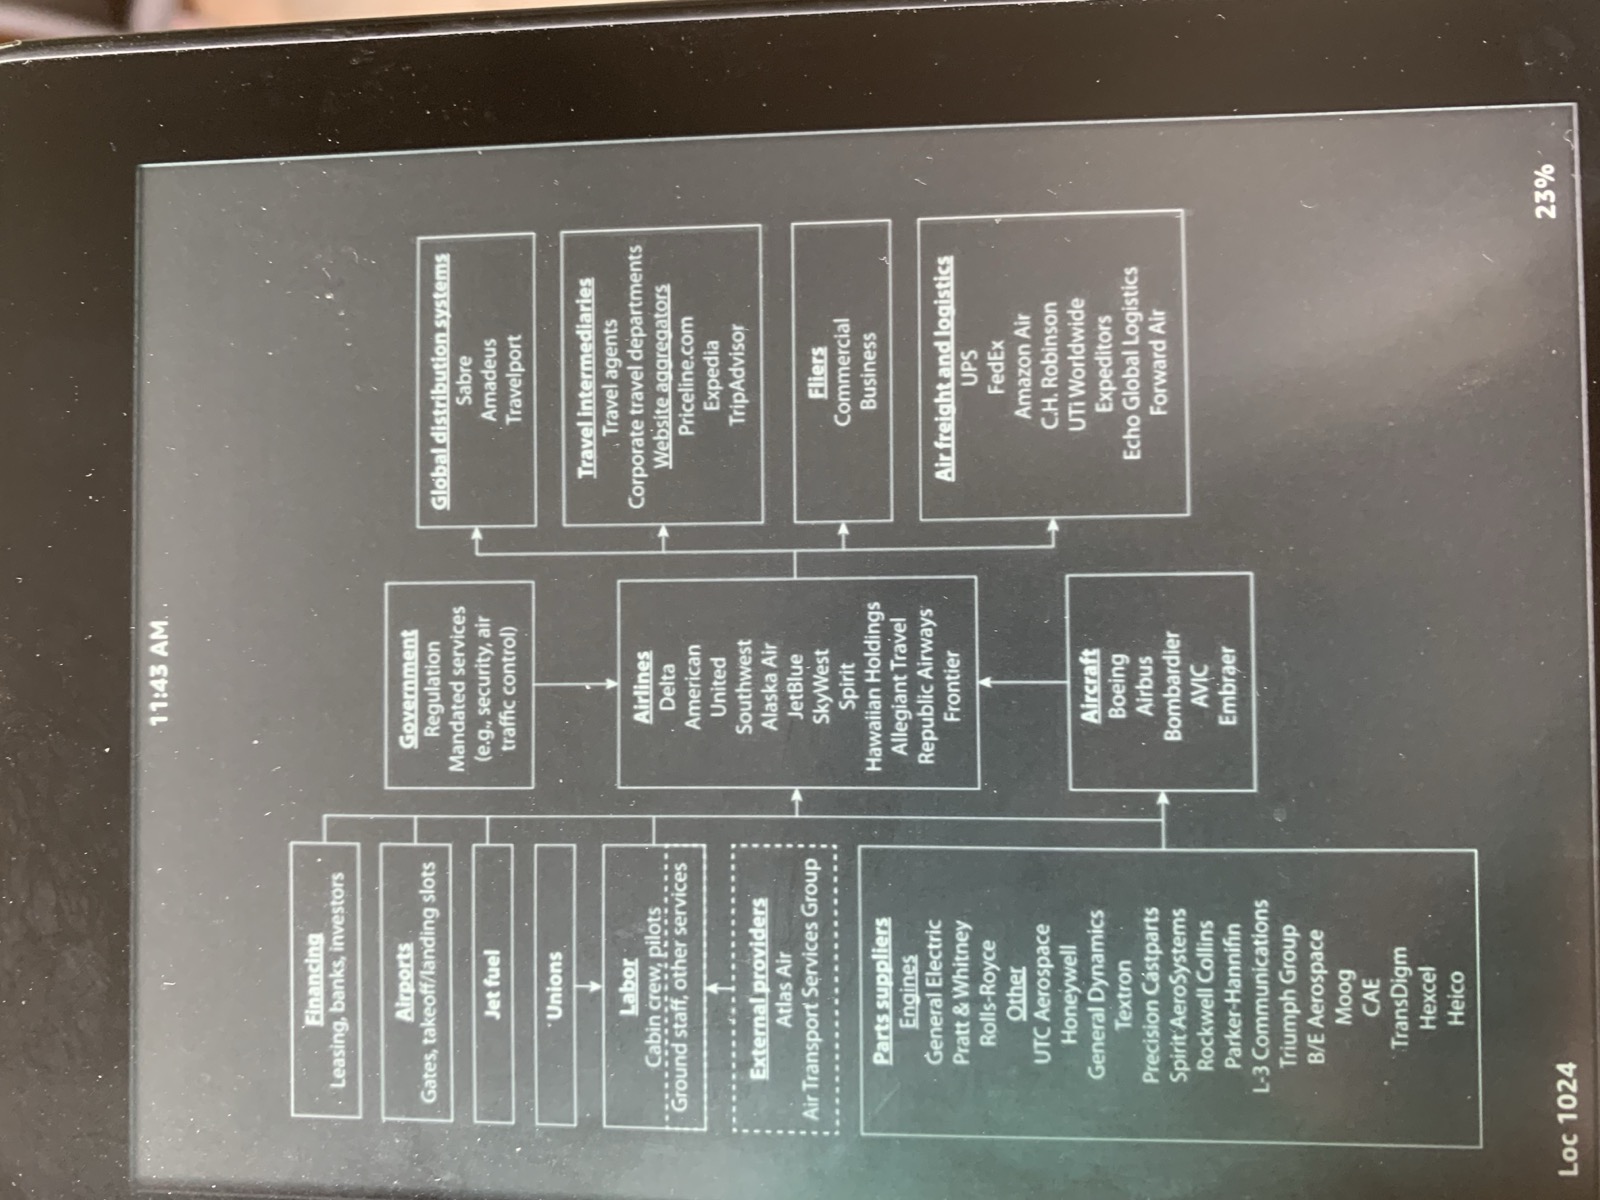
Creating a map also provides a good opportunity to think about the potential for new entrants. Consider which companies are not on the map now but are logical competitors in the future. The map also allows for an understanding of the nature of the economic interaction between companies.
A value pool analysis allows you to see an industry’s value creation. The horizontal axis is a measure of size, such as sales or assets. The vertical axis reflects the spread between the operating profit margin and the threshold margin. Recall that threshold margin is the margin at which the company earns exactly the cost of capital. The value pool analysis tells you how big a company is and how much value it creates.

Industry Analysis
We suggest two frameworks to guide industry analysis, both developed by professors at Harvard Business School. First is Michael Porter’s well-known five forces framework, which helps define industry structure and is particularly useful for competitive analysis (figure 4.3).5 Second is Clayton Christensen’s model of disruptive innovation, which helps us anticipate the risk of companies failing.
Five Forces Framework analysis is applicable to most industries, but especially to those with the following three characteristics: • Defined boundaries. You can readily define buyers, suppliers, and competitors. • Mature and relatively predictable patterns. The industry is relatively stable. • A physical-capital orientation. Physical assets are central to value creation.
Substitution threat
Buyer power is the bargaining strength of the buyers of a product or service.
Supplier power is the degree of leverage a supplier has with its customers in areas like price, quality, and service.
Barriers to entry determine how difficult it is for a new competitor to enter an industry.
Rivalry among firms addresses how fiercely companies compete with one another along dimensions such as price, service, warranties, new-product introductions, and advertising.
challenger’s decision to enter an industry starts with an assessment of the expected response of the incumbents. Specific factors that predict the ferocity of incumbent reaction include asset specificity, the level of the minimum efficient production scale, excess capacity, and incumbent reputation.
Examples of asset specificity include site specificity (a company locates assets next to a customer for efficiency), physical specificity (a company adapts assets to a specific transaction), dedicated assets (a company acquires assets to satisfy the needs of a particular buyer), and human specificity (a company provides specific skills or knowledge to its employees in order to target a particular business relationship).
Unit costs decline as output rises in most industries. At some point, unit costs stop declining with incremental output and companies realize constant returns to scale. Minimum efficient scale is the smallest amount of production a company must achieve to minimize unit costs. It allows a challenger to figure out the size of its up-front investment and how much market share it needs to be competitive and create value.
The last two factors, excess capacity and incumbent reputation, are straightforward. If an industry has excess capacity, an entrant will add to that capacity and hence lead to lower prices. A firm’s reputation as a fighter or as accommodating, backed by words and actions, will shape a potential entrant’s decision.
Model of Disruptive Innovation
Disruptive Innovation is particularly relevant for the following types of companies: • Market leaders. These companies listen to their customers and focus on current profits. As a result, their inertia and incentives often cause them to miss significant technological shifts. • Organizationally centralized companies. Companies that centralize their decision making often have difficulty seeing disruptive technologies emerge. • Companies that employ physical goods. Incumbents can struggle as the products they sell transition from physical to digital.
First, sustaining technologies and disruptive technologies are quite distinct. Sustaining technologies foster product improvement. They can be incremental, discontinuous, or even radical. But sustaining technologies operate within a defined value network, which he defines as the “context within which a firm identifies and responds to customers’ needs, solves problems, procures input, reacts to competitors, and strives for profit.”10 Disruptive technologies offer the market a very different value proposition.
Products based on disruptive technologies may initially appeal only to a relatively few customers who value features such as low price, smaller size, or greater convenience. Other disruptive technologies comprise a new or emerging market segment that industry incumbents do not serve. Christensen finds that disruptive technologies generally underperform established products in the near term
Second, technologies often progress faster than the market demands. Established companies commonly provide customers with more than they need or more than they are ultimately willing to pay for. This allows disruptive technologies to emerge because even if they underperform the demands of many users today, the improvement in their performance makes them fully competitive tomorrow.
Finally, passing over disruptive technologies may appear rational for established companies because disruptive products generally offer low margins, operate in insignificant or emerging markets, and are not in demand by the company’s most profitable customers. As a result, companies that listen to their customers and practice conventional financial discipline are apt to pass on disruptive technologies.
You can’t assess a company’s actions in a void because companies respond to each other’s competitive moves.
you’re thinking about building a new paper facility, you’re going to base your decision on some assumptions about economic growth…. What we never seem to factor in, however, is the response of our competitors. Who else is going to build a plant or machine at the same time?
The five forces analysis is a valuable way to understand the drivers of profitability at the industry level, and the disruptive innovation framework is useful to assess threats to the status quo. But we ultimately want to understand potential expectations revisions for individual companies. For that we need to turn to an assessment of a firm’s relative position.
How Companies Add Value: Value created = Willingness to pay − Opportunity cost
This leads to the two main ways a company can create value. The first is to be able to increase the willingness to pay of customers while remaining competitive on costs. That strategy is generally called differentiation. When you hear differentiation, you should think of the ability to charge a higher relative price.
The second is the ability to produce a good or service at a lower relative cost while being able to charge a sufficient price. This is a low-cost strategy.
Value chain analysis is relevant for most businesses, but especially those engaging in two key types of activities: • Vertically integrated activities. Vertically integrated businesses engage in all the activities necessary to convert raw materials into a final product. Value chain analysis helps identify which activities a company performs relatively efficiently. This analysis is especially useful when a company can substantially improve or outsource low-return activities. • Activities susceptible to technological change. Technology causes value chains to disintegrate and allows companies to specialize in a narrow set of activities. Vertically integrated companies that rely on a handful of activities for their profitability are at risk from specialized companies that perform a specific activity better.
Magretta suggests some ways to use the value chain to pinpoint a company’s potential sources of competitive advantage:
Compare the company to the industry.
Identify the drivers of price or sources of differentiation.
Identify the drivers of cost.
Value chain thinking, Magretta suggests, leads to some important consequences. The first is that activities are no longer viewed solely as costs but as steps that add value to the end good or service. This allows you to match the value chain to what creates value for customers.
The second is that this analysis compels a look beyond the firm to include a larger value system that includes other entities. For instance, e-commerce companies such as Amazon.com rely on the ability to deliver products on time. They need to execute activities to make sure that the shippers they rely on for delivery get the job done.
Information Economics
In recent decades, the primary form of investment for many companies has shifted from tangible to intangible assets.
companies based on knowledge assets have characteristics that are distinct from companies based on physical assets. As a result, you must evaluate them somewhat differently.
Here are some attributes of information goods worth considering:
up-front costs, low incremental costs. Many knowledge products are very costly to create the first time. Once in digital form, however, they are relatively inexpensive to replicate and distribute.
Network effects exist when the value of a product or service increases as more members use that product or service.
Lock-in. Once customers develop user skills with a given product, or set corporate standards for a product, they often hesitate to switch to a competing offering, even if a rival product performs better or has a lower price. Hence, the company has “locked in” customers, making them more open to purchasing highly profitable product upgrades than they are to purchasing products from other sources.
Aggregation theory. Aggregators are companies that consolidate abundant content from suppliers and make the content easily accessible for users. Google is a classic example.
Thompson suggests that successful aggregators have three main characteristics: They own the relationship with the user, there is zero (or very low) marginal cost to serve new users, and the cost to acquire users goes down as the result of positive feedback.
Platform companies. Platform companies facilitate the relationship between third-party suppliers and end users.
These businesses create an ecosystem and take a small amount of the value created.
Aggregators enjoy economies of scale that create a formidable barrier to entry. Platforms become integral to ecosystems such that they create substantial switching costs for users.
“customer-based corporate valuation,” or CBCV. This approach values a company from the bottom up by analyzing the economics of customer relationships.
The value of a customer is the difference between the present value of the cash flows the customer generates during his or her tenure and the cost to acquire the customer. Cash flows are revenues minus all associated costs. Customer retention is commonly expressed as churn, or the percentage of customers that stop using a company’s product or service during a certain period.
CBCV’s main contribution is the ability to accurately forecast sales growth. This is extremely useful as sales growth is commonly the most important value driver.
How fast new customers are added, a customer retention model to understand how long they will remain active buyers, a purchase model to understand how often they will buy, and a model to understand how much they will purchase when they do transact.
Expectations investing is not just about prospective changes in operating value drivers. It helps investors make informed judgments about where to find potentially profitable opportunities by integrating the expectations infrastructure with competitive strategy analysis.
How to Estimate Price-Implied Expectations
you need to clearly understand where expectations stand today before you can consider the likelihood and magnitude of expectations revisions.
The ideal solution allows you to use the discounted cash flow model without the burden of cash flow forecasts. This is precisely what expectations investing does. Instead of forecasting cash flows, expectations investing starts with the current stock price and uses the discounted cash flow model to “read” what the market implies about a company’s future performance.
Reading Expectations
Cash Flows
Cost of Capital
Nonoperating Assets and Debt
Market-Implied Forecast Period
The final value determinant is the number of years of free cash flows required to justify the stock price. We call this horizon the market-implied forecast period. (It’s also called “value growth duration” and “competitive advantage period” and is consistent with the idea of “fade rate.”)3
The first thing you want to do is isolate the value trigger that is likely to have the greatest impact on shareholder value. We call this the turbo trigger. Just as a turbo charger on a car substantially increases its power, the turbo trigger gives you the ability to figure out what matters most.
Identifying Expectations Opportunities
You should refine your initial estimates of turbo trigger variability before you decide to buy, sell, or hold.
Specifically, drill down one more level to the leading indicators of value. Leading indicators are measurable, current accomplishments that significantly affect the turbo trigger and hence shareholder value. Examples include customer retention rates, time to market for new products, number of on-time new-store openings, quality improvements, and average cycle time from order date to shipping date.
Pitfalls to Avoid
We all occasionally fall into psychological traps that keep us from achieving higher investment returns. These traps materialize when we use rules of thumb, or heuristics, to reduce the information demands of effective decision making. While heuristics simplify analysis, they can also lead to biases that undermine the quality of our decisions.
Remember the concept of overprecision when you estimate the high and low scenarios for sales growth as part of the initial step in the search for expectations opportunities. A frequent error is to consider a range of outcomes that is insufficiently wide. For example, if your estimated range is too narrow, you may misidentify the turbo trigger as costs or investments when, in fact, you should select sales.
The second pitfall is confirmation bias, which occurs when we seek information that confirms our beliefs and dismiss, disregard, or discount information that runs against our view.
Four building blocks constitute the foundation for identifying expectations opportunities. Historical results and PIE give us the data, and competitive strategy analysis and the expectations infrastructure give us the analytical tools.
Identifying expectations opportunities embodies three steps: • Step 1: Estimate high and low values for the sales trigger and calculate the shareholder values that result. • Step 2: Select the turbo trigger. • Step 3: Refine the high and low estimates of the turbo trigger and calculate the shareholder values that result. • Beware of behavioral traps as you estimate ranges.
The Buy Decision
Your decision depends on two factors. The first is the stock price’s percentage discount to expected value, or its margin of safety. The greater the discount to expected value, the higher the prospective excess return.
The second factor is how long it will take for the market to revise its expectations. The sooner the stock price converges to the higher expected value, the greater the excess return.
Before we leave the buy decision, we urge that you avoid falling into the escalation trap. Investors tend to make choices that justify past decisions. Past investments of money or time that cannot be recovered create what economists call sunk costs. Even though investors know that sunk costs are irrelevant to current decisions, some find it hard to separate the two.
The Sell Decision
There are three potential reasons to sell a stock:
- The stock has reached your original expected value and your latest expected value estimate is lower than the stock price. A note of caution is in order here. Investing is a dynamic process. Expectations are a moving target that you must periodically revisit and revise as necessary. Investors who mechanistically sell shares just because they reach a target price that is out of date run the risk of sacrificing significant returns.
- Better opportunities exist. Investors who actively manage their portfolios will ideally hold the stocks that are most attractive today.
- You have revised your expectations downward. Sometimes even thoughtful and detailed analysis misses the mark. At other times, unanticipated events prompt you to make a material change in your expectations.
Beyond Discounted Cash Flow
WHEN YOU APPLY the expectations investing process, you will run across companies with price-implied expectations that appear more optimistic than what the existing businesses and industry norms would lead you to anticipate. It can be a mistake to automatically conclude that expectations are too optimistic in these cases.
The discounted cash flow model is all you need to estimate the expectations for most businesses. But many investors have come to question the model’s role in valuation because it does not easily explain why some start-ups, especially those that lose money, enjoy such large market capitalizations. We believe that the discounted cash flow model is as relevant as ever if you complement it with a real options analysis for select companies.
A financial option gives its owner the right, but not the obligation, to buy or sell a security at a set price. Analogously, companies that make strategic investments have the right, but not the obligation, to take advantage of these opportunities in the future.
Traditional valuation tools, including discounted cash flow, don’t value the contingent nature of an option.
We don’t need to understand the intricacies of an option-pricing model to understand what fundamentally increases real options value. Value rises when the net present value (S − X) increases, when we extend the time we can defer decisions (T), or when uncertainty (σ) rises.
Real options values are potentially significant under the following conditions: • There must be a high level of uncertainty, or volatility of outcomes. Industries with low volatility have little real options value. For example, consulting firms are businesses with low volatility. They find it difficult to generate huge upside surprises because they essentially sell their services by the hour.
The management team must have the strategic vision to create, identify, evaluate, and nimbly exploit opportunities in a dynamic environment. The existence of real options doesn’t guarantee that a company will capture their value.
Market-leading businesses tend to get the best look at potential value-creating opportunities to expand or extend their business.
The business should be a market leader.
We’ve developed a simple matrix that helps you consider when you need to introduce a real options analysis into the expectations investing process
No real options analysis required (low potential/low imputed real options value). This combination captures most established companies. All you need here is the standard expectations investing process
Buy candidate (high potential/low imputed real options value). In essence, you assign a higher value to real options than the market does. The stock is a buy candidate if the difference is adequate.
Sell candidate (low potential/high imputed real options value). Here the reverse is true. The market values real options more highly than you do. The stock is a sell candidate when the gap is sufficiently sizable.
Real options analysis required (high potential/high imputed real options value). This quadrant is where more detailed real options analysis promises the greatest potential payoff for investors. The rest of this section focuses on companies that fall into this quadrant.
Sources of Expectations Opportunities
- Using Probabilities for Opportunity, Feedback, and a Prompt
- Assessing Macroeconomic Shocks
- Evaluating Changes in Senior Management
- Judging Stock Splits, Dividends, Stock Buybacks, and Stock Issuance
- Estimating the Impact of Lawsuits
- Capturing External Changes: Subsidies, Tariffs, Quotas, and Regulations
- Measuring the Impact of Divestitures
- Coping with Extreme Stock-Price Moves